library(here)       # manage file paths
library(socviz)     # data and some useful functions
library(tidyverse)  # your friend and mine
library(tidycensus) # Tidily interact with the US Census07 — Social Data, Social Categories, and the State
February 21, 2024
Groups and relationships
penguins |>
  ggplot(mapping = aes(x = bill_length_mm, y = bill_depth_mm)) +
  geom_point() +
  geom_smooth(method = "lm", color = "black", se = FALSE)
Groups and relationships
penguins |>
  ggplot(mapping = aes(x = bill_length_mm, y = bill_depth_mm)) +
  geom_point(mapping = aes(color = species)) +
  geom_smooth(method = "lm", color = "black", se = FALSE)
Groups and relationships
penguins |>
  ggplot(mapping = aes(x = bill_length_mm, y = bill_depth_mm)) +
  geom_point(mapping = aes(color = species)) +
geom_smooth(method = "lm", color = "black", se = FALSE) 
Groups and relationships
penguins |>
  ggplot(mapping = aes(x = bill_length_mm, y = bill_depth_mm)) +
  geom_point(mapping = aes(color = species)) +
  geom_smooth(method = "lm", color = "black", se = FALSE) +
  geom_smooth(mapping = aes(color = species, fill = species),
              method = "lm")
What is data?

A Trace
A Record
An Account
What is data?

A Story
A Memory
A Promise
What is data?
A Story
A Memory
A Promise
What is data?
An Action
A Device
A Resource
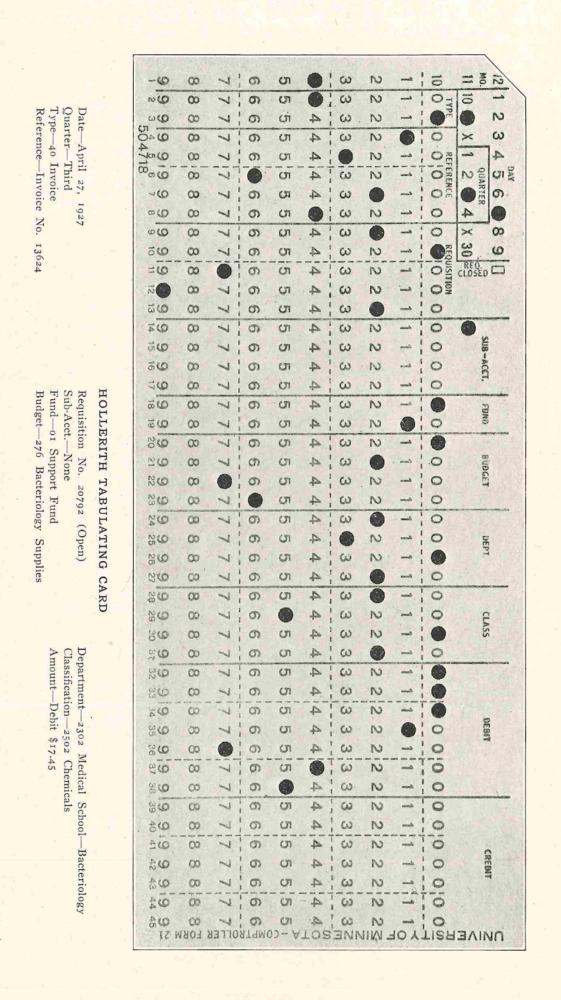
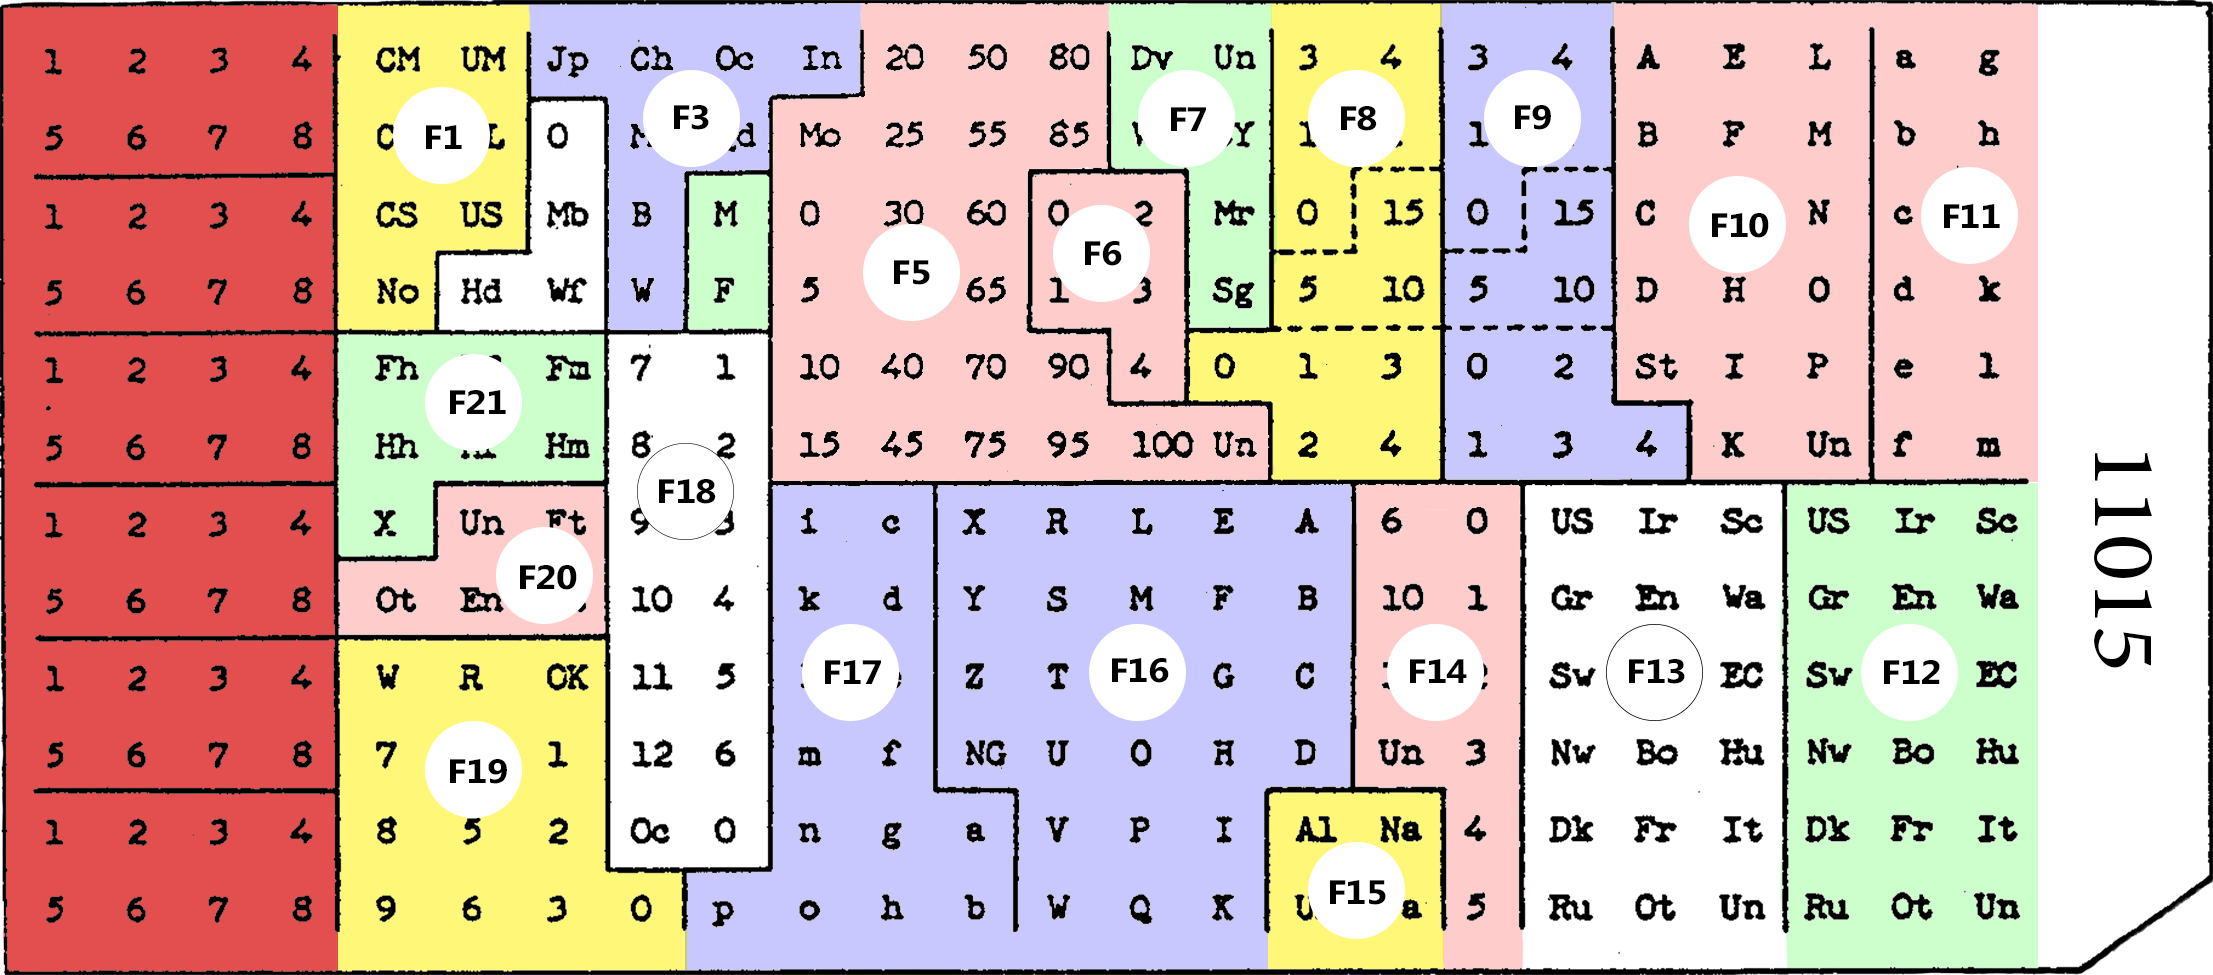
What is data
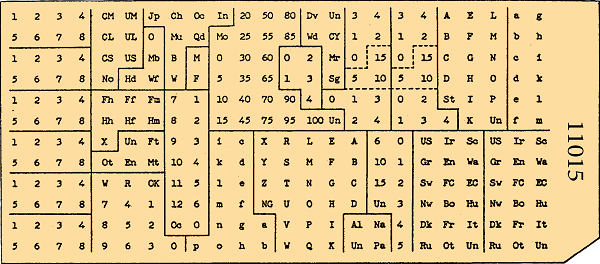
What is data
The U.S. Census
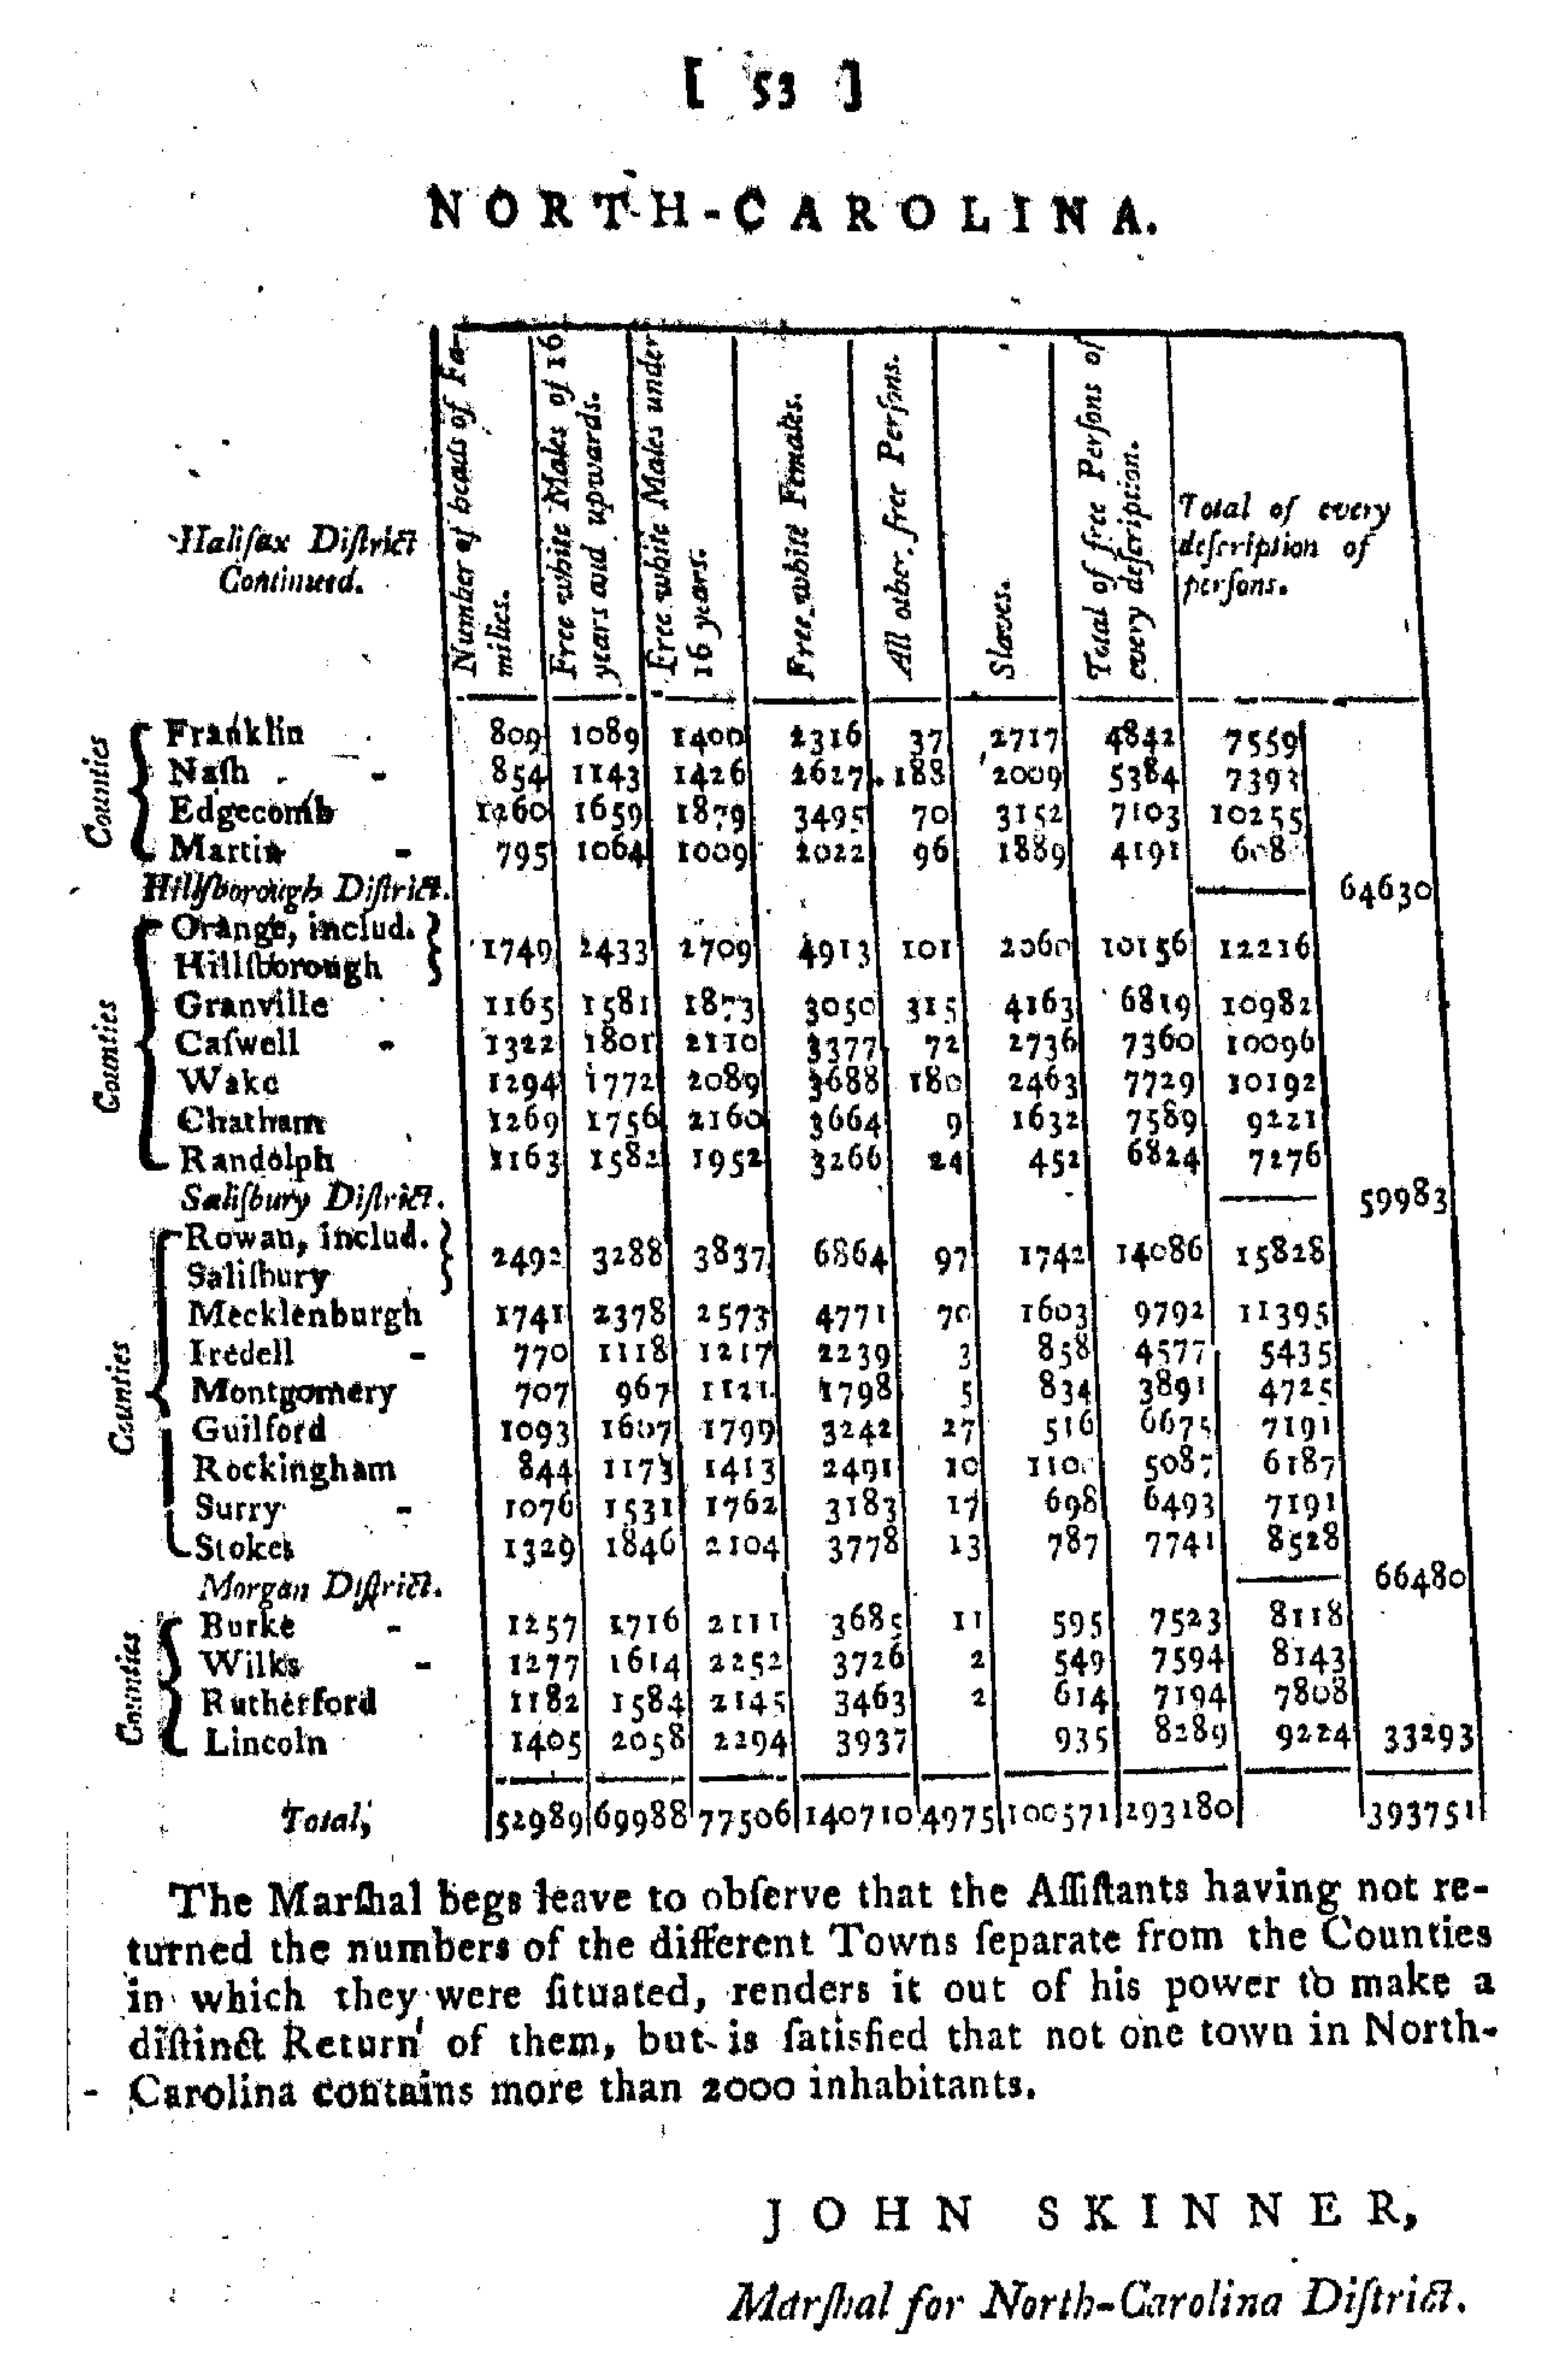
1790 Census record, North Carolina
The U.S. Census
1930
- “Mexican” a racial category
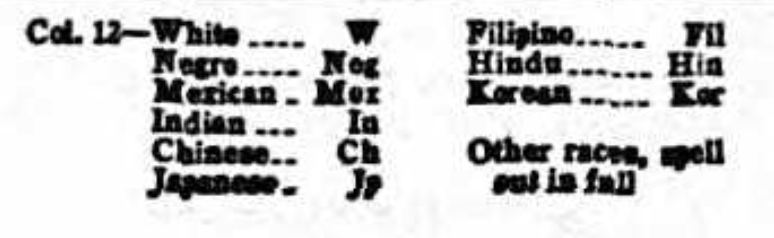
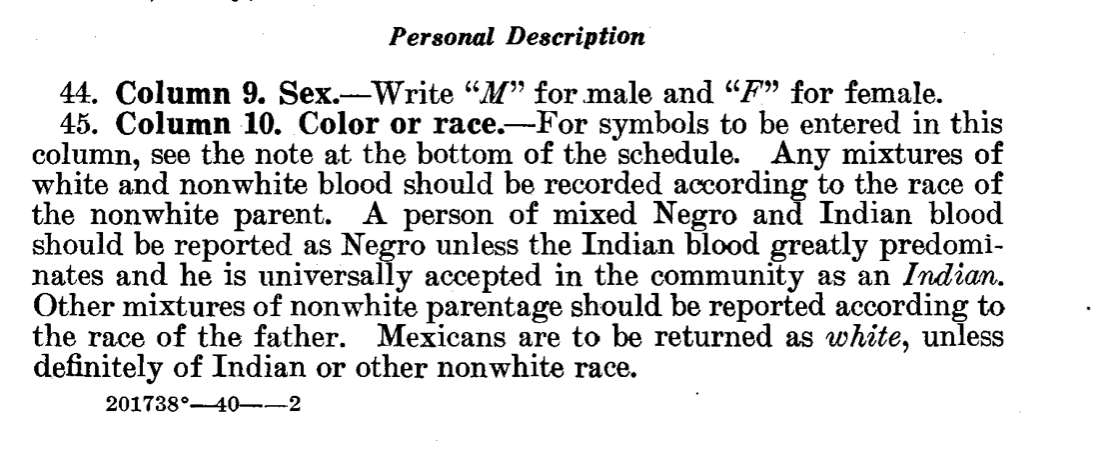
The U.S. Census
1930
- “Mexican” a racial category
1940
The U.S. Census
1970
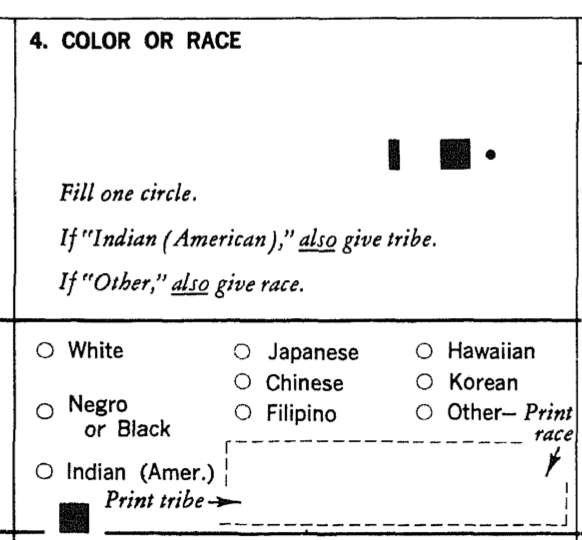
The U.S. Census
1980
- Race and Ethnicity
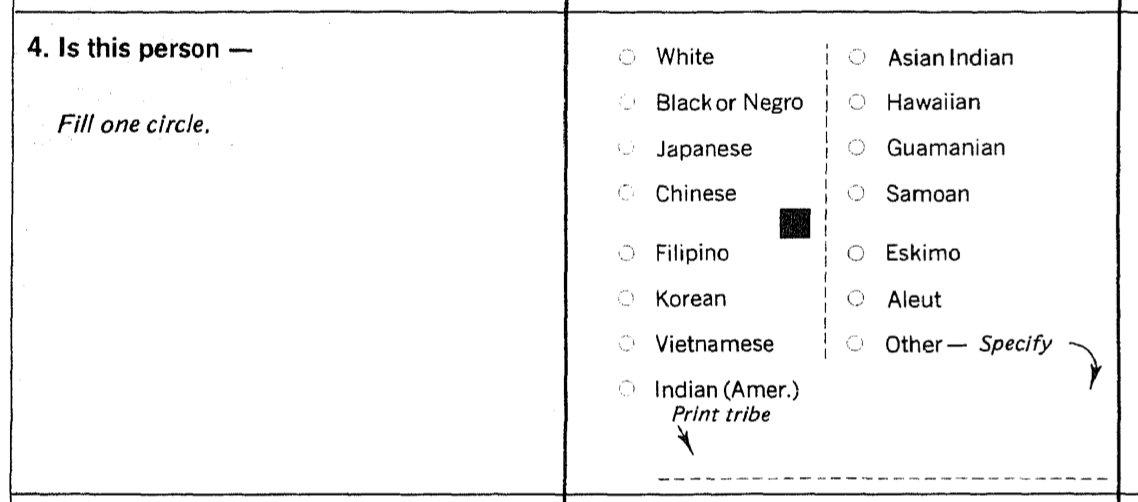
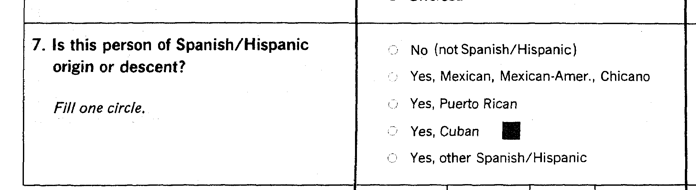
The U.S. Census
1990
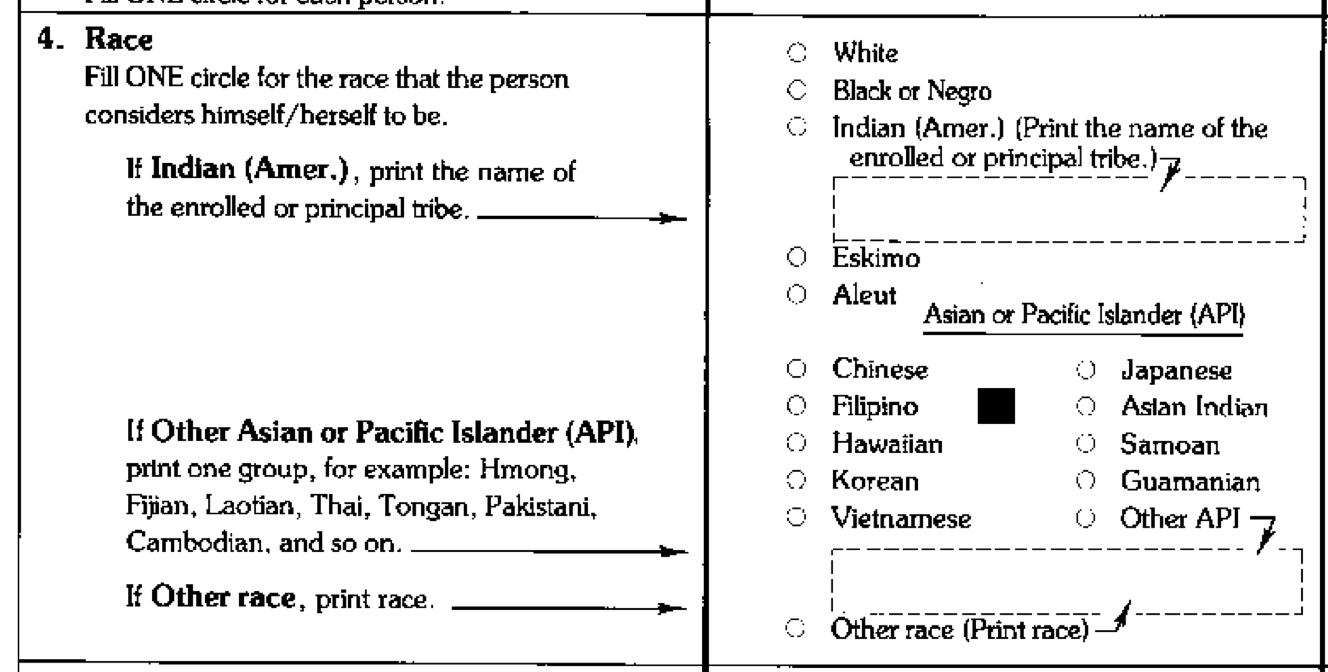
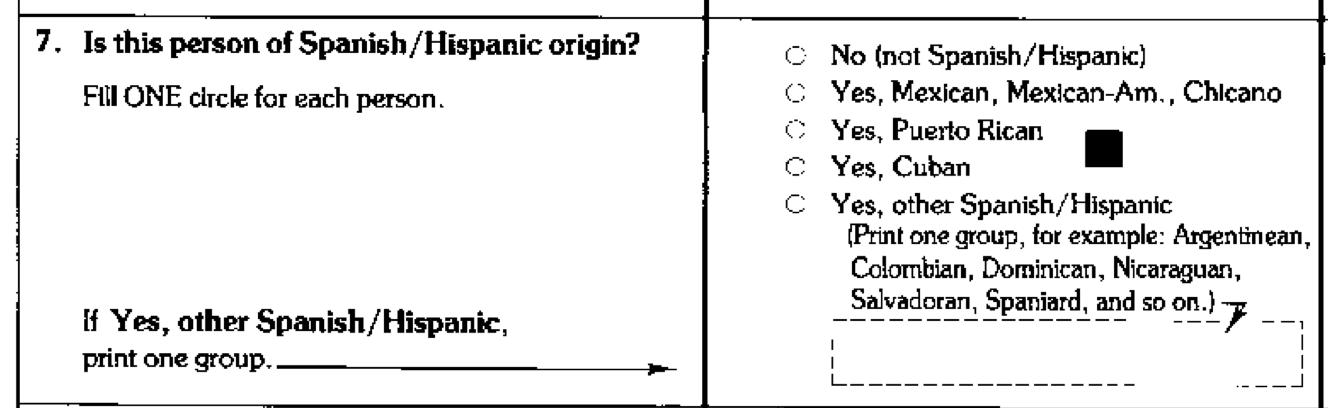
The U.S. Census
2000
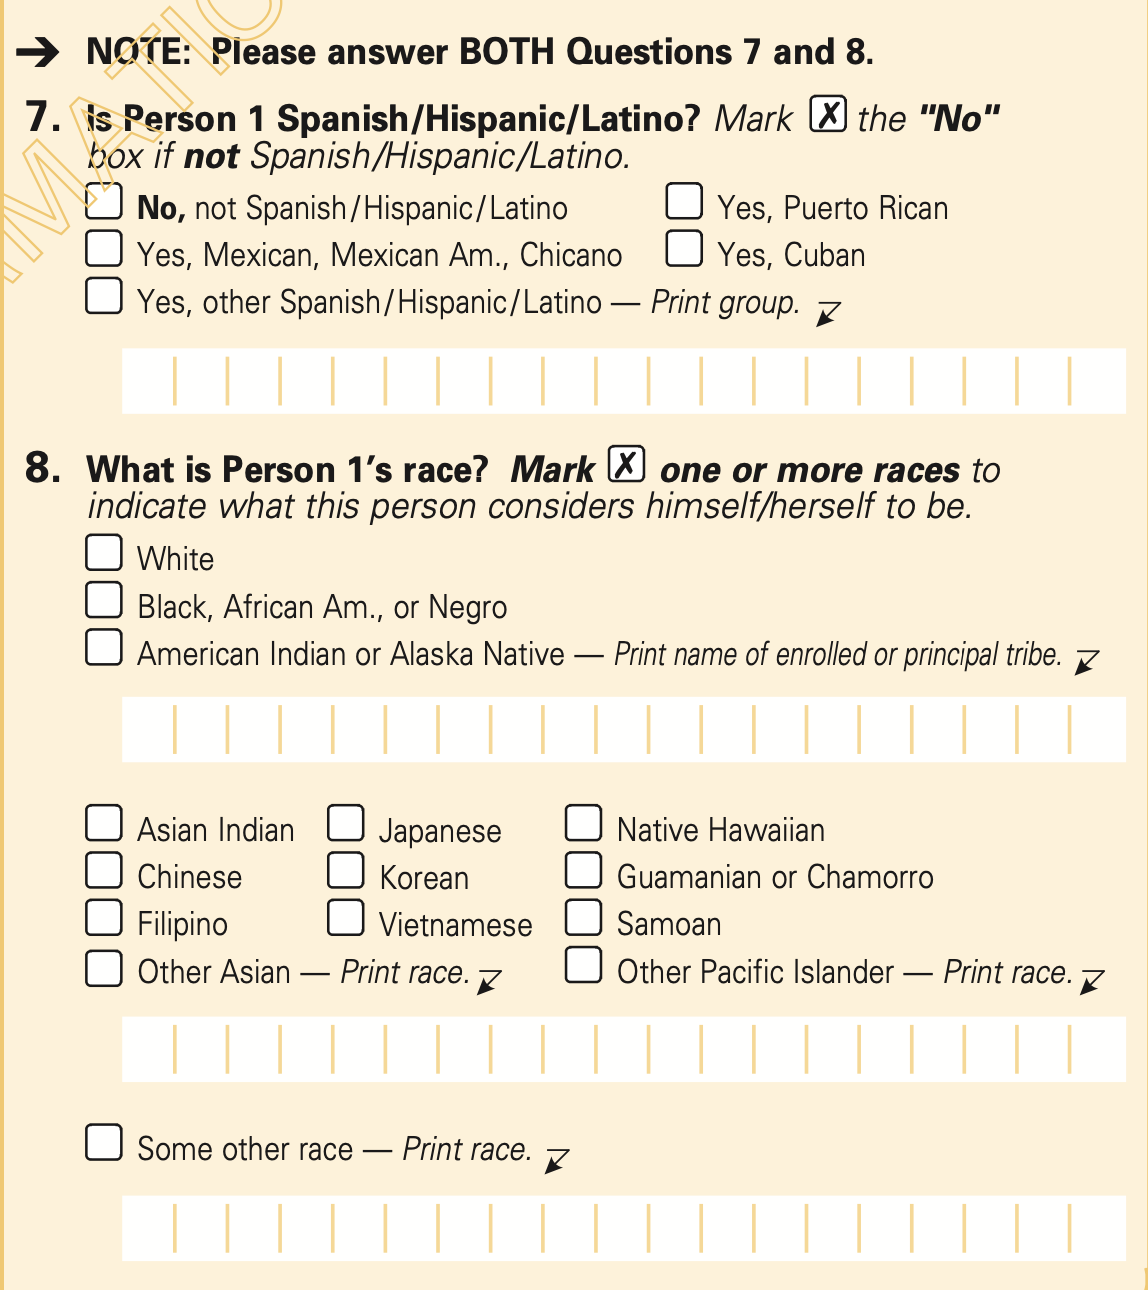
The U.S. Census
2010
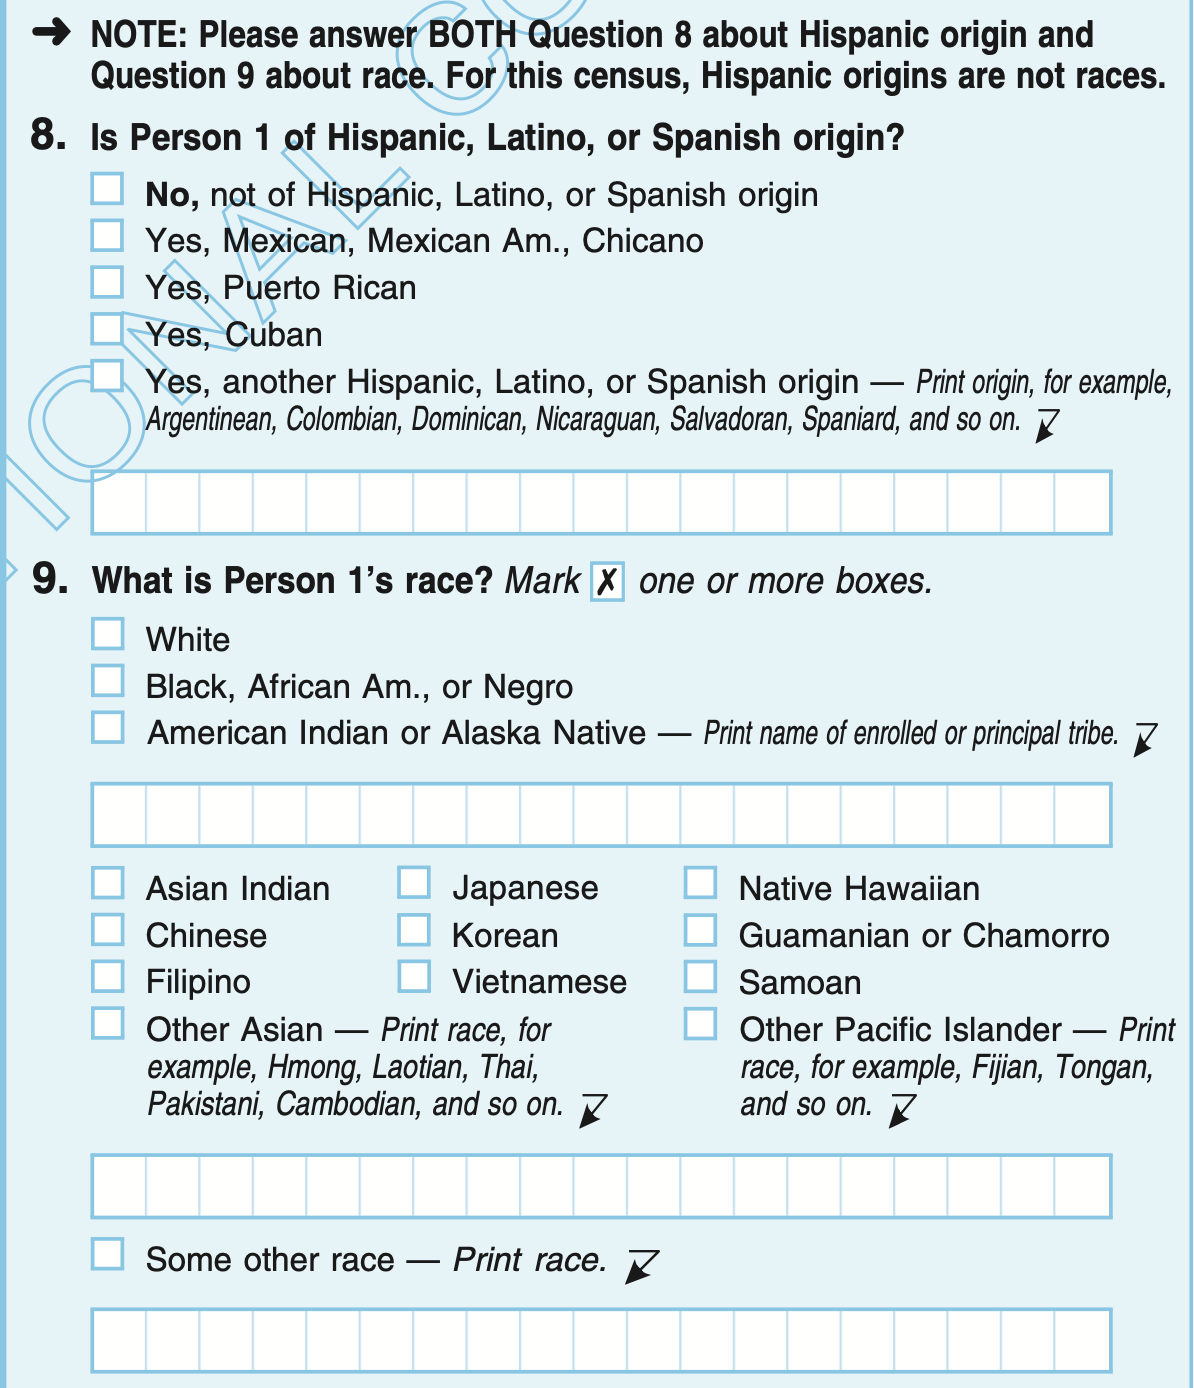
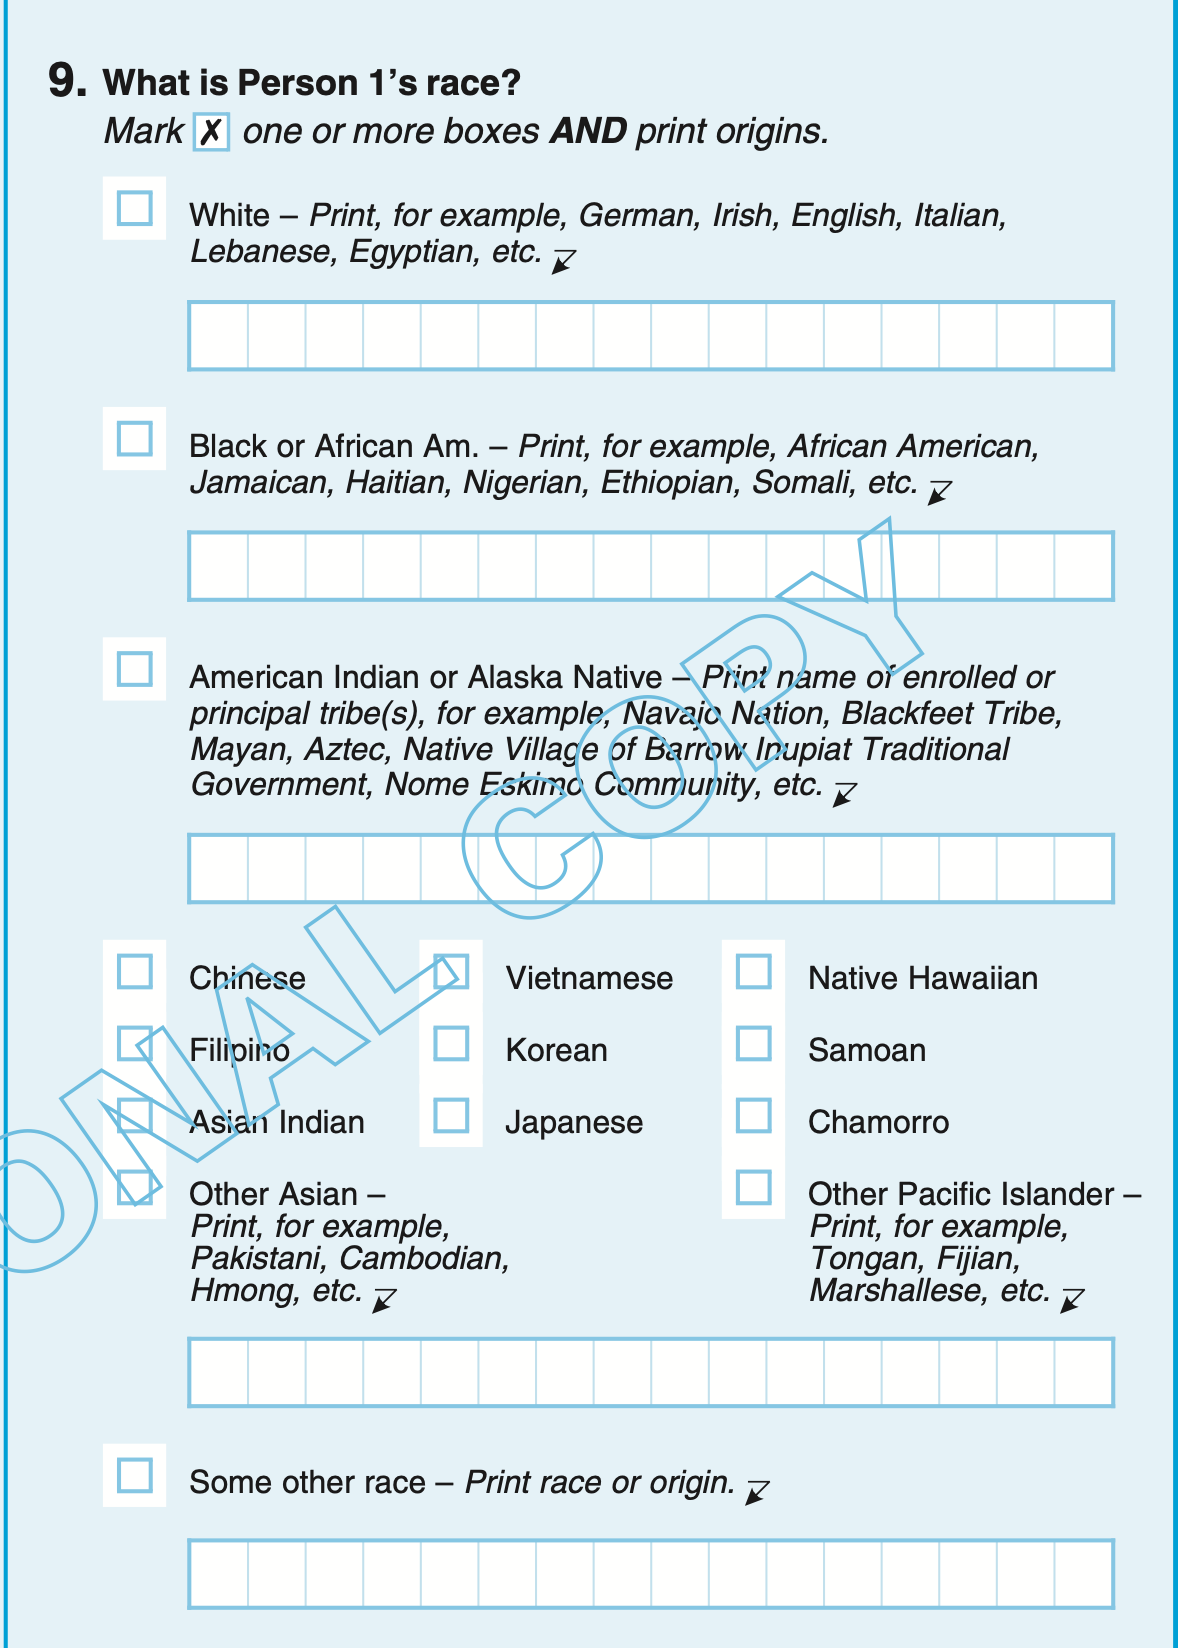
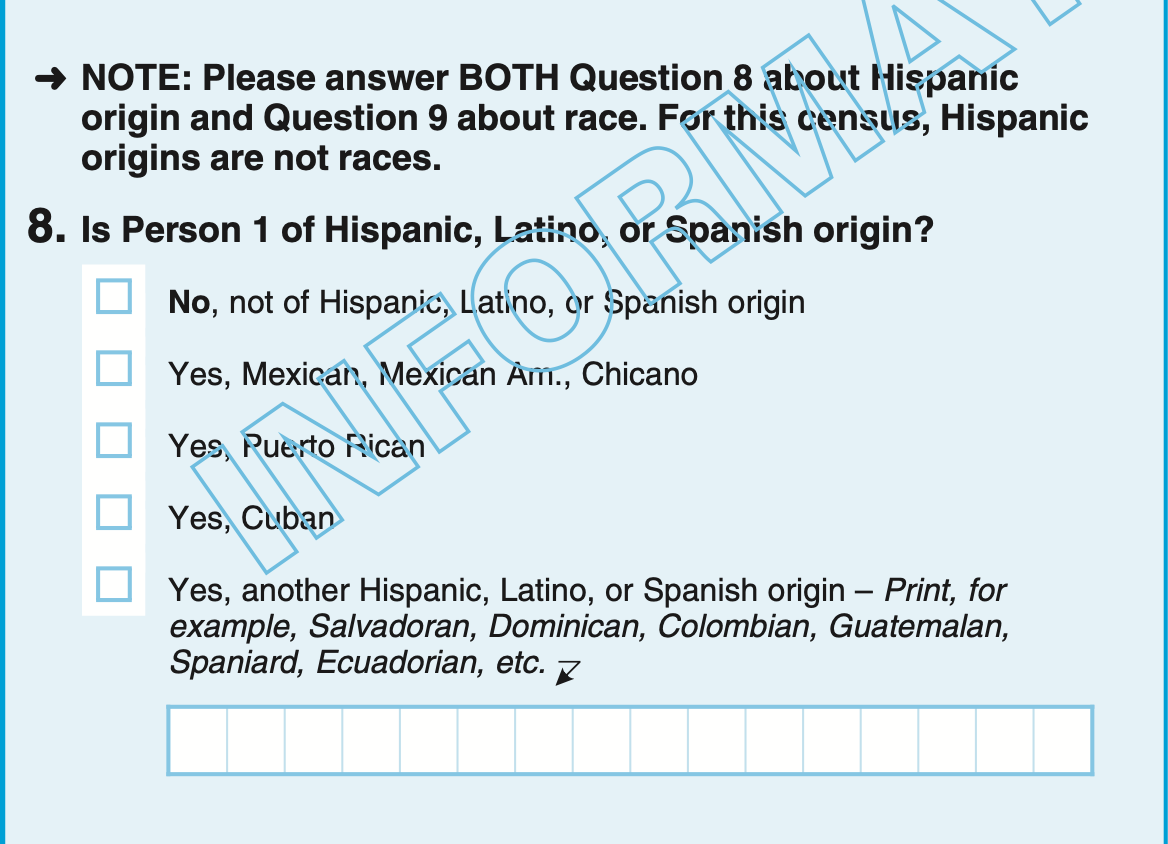
The U.S. Census
2020
Categories and Classes
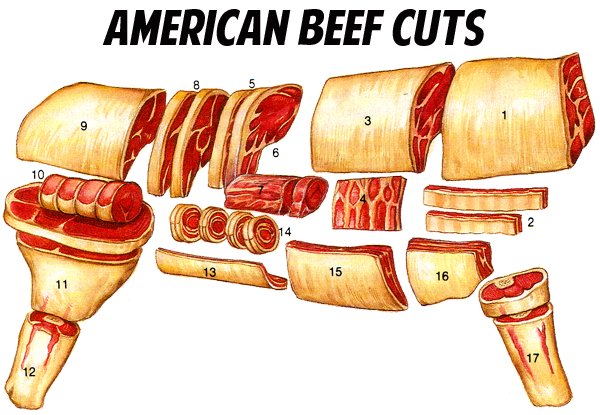
American Beef Cuts
Categories and Classes
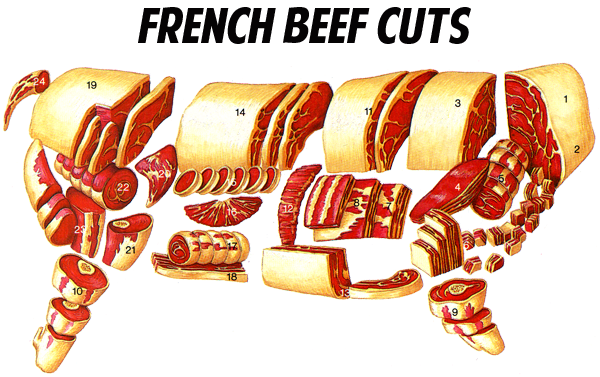
French Beef Cuts
Categories and Classes
Categories and Classes
Categories and Classes
Categories and Classes

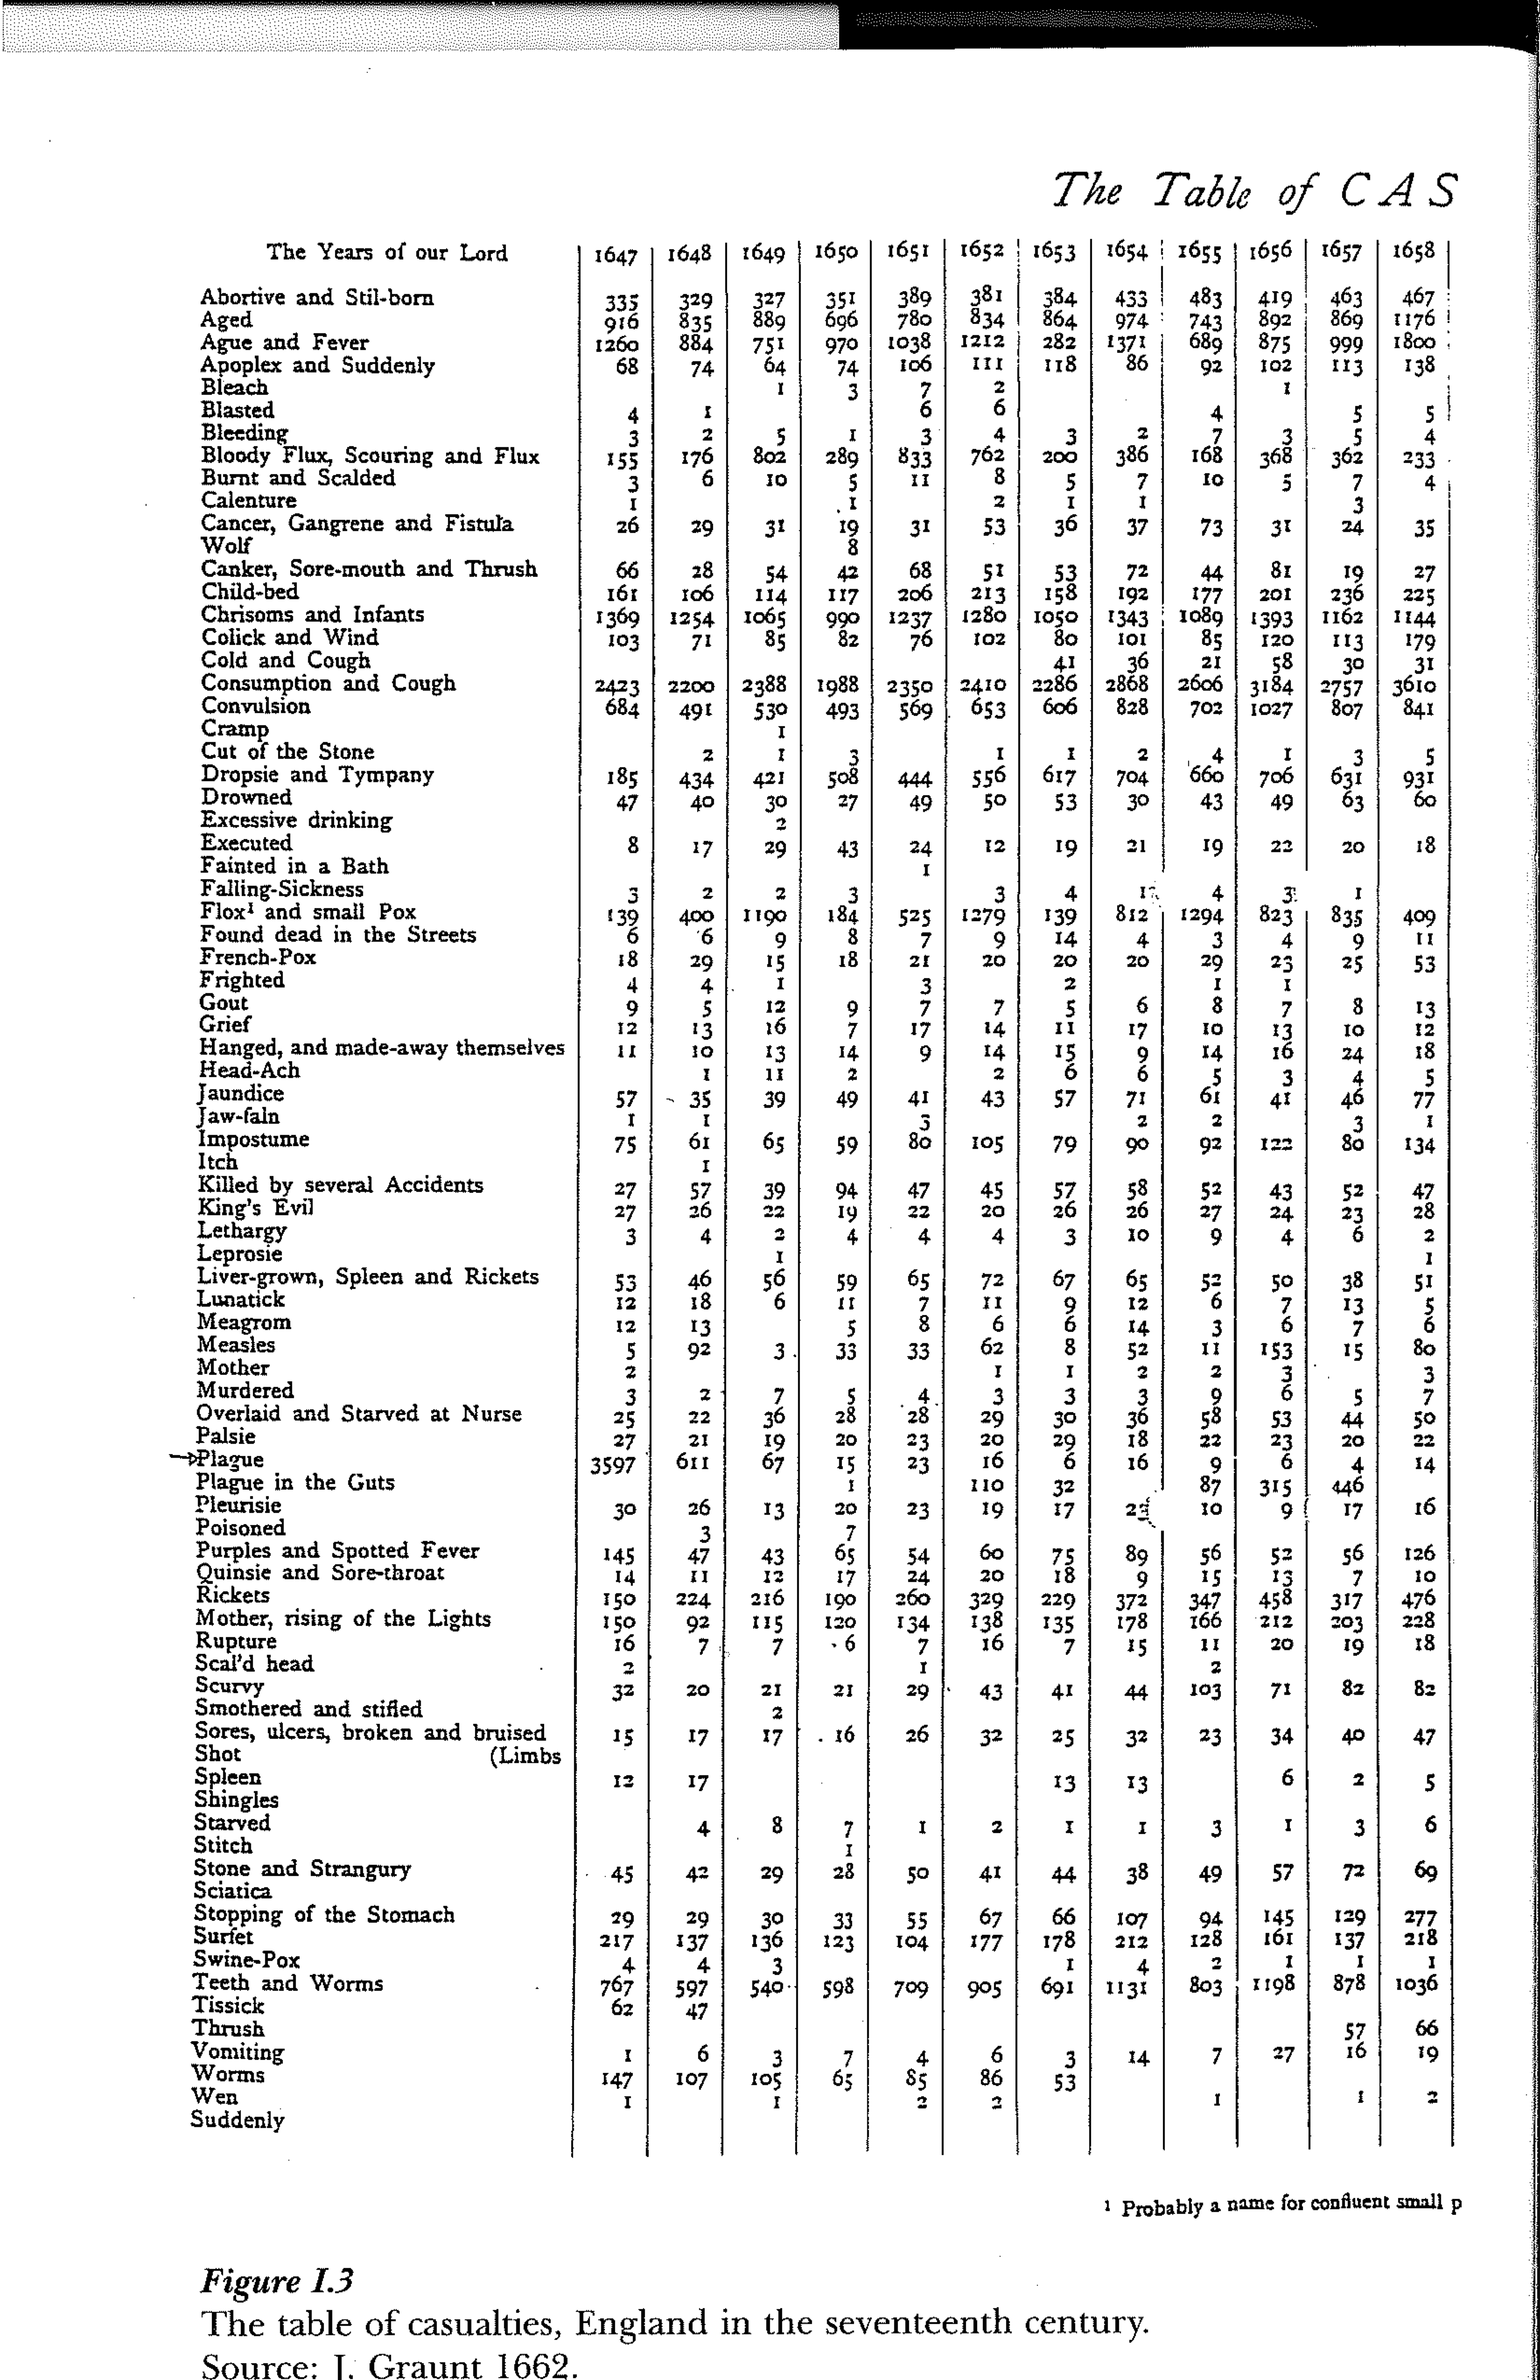
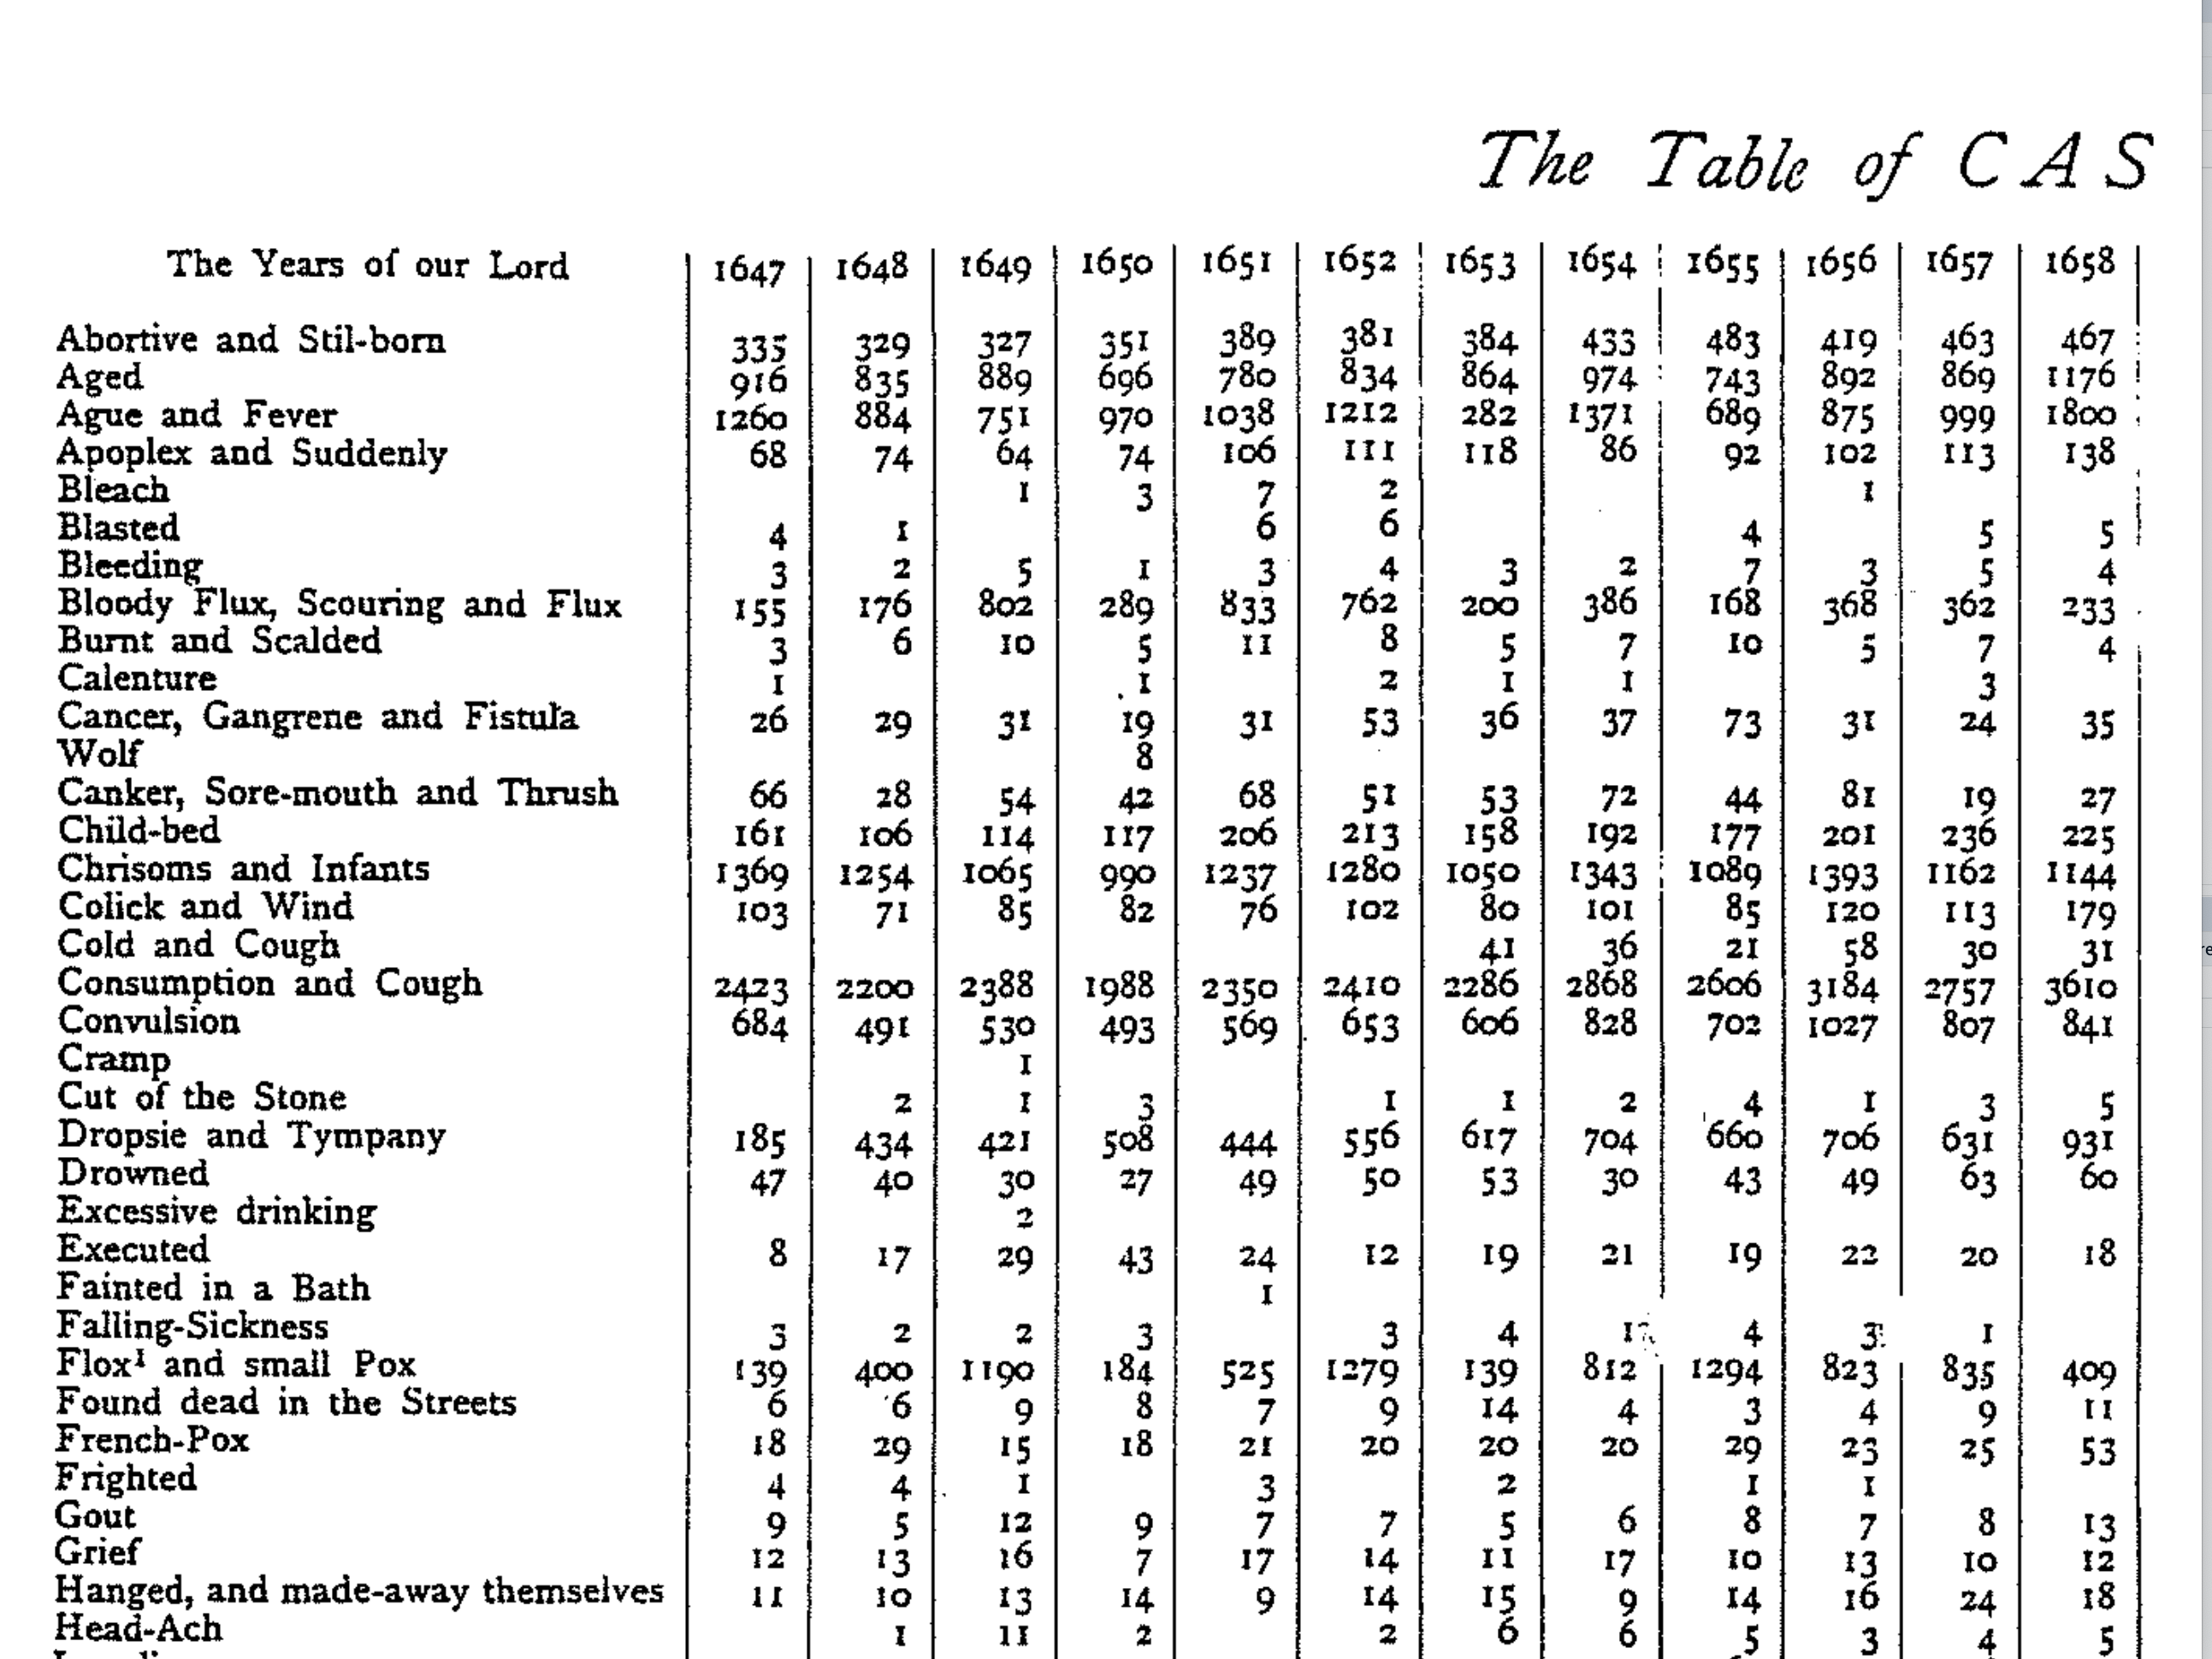
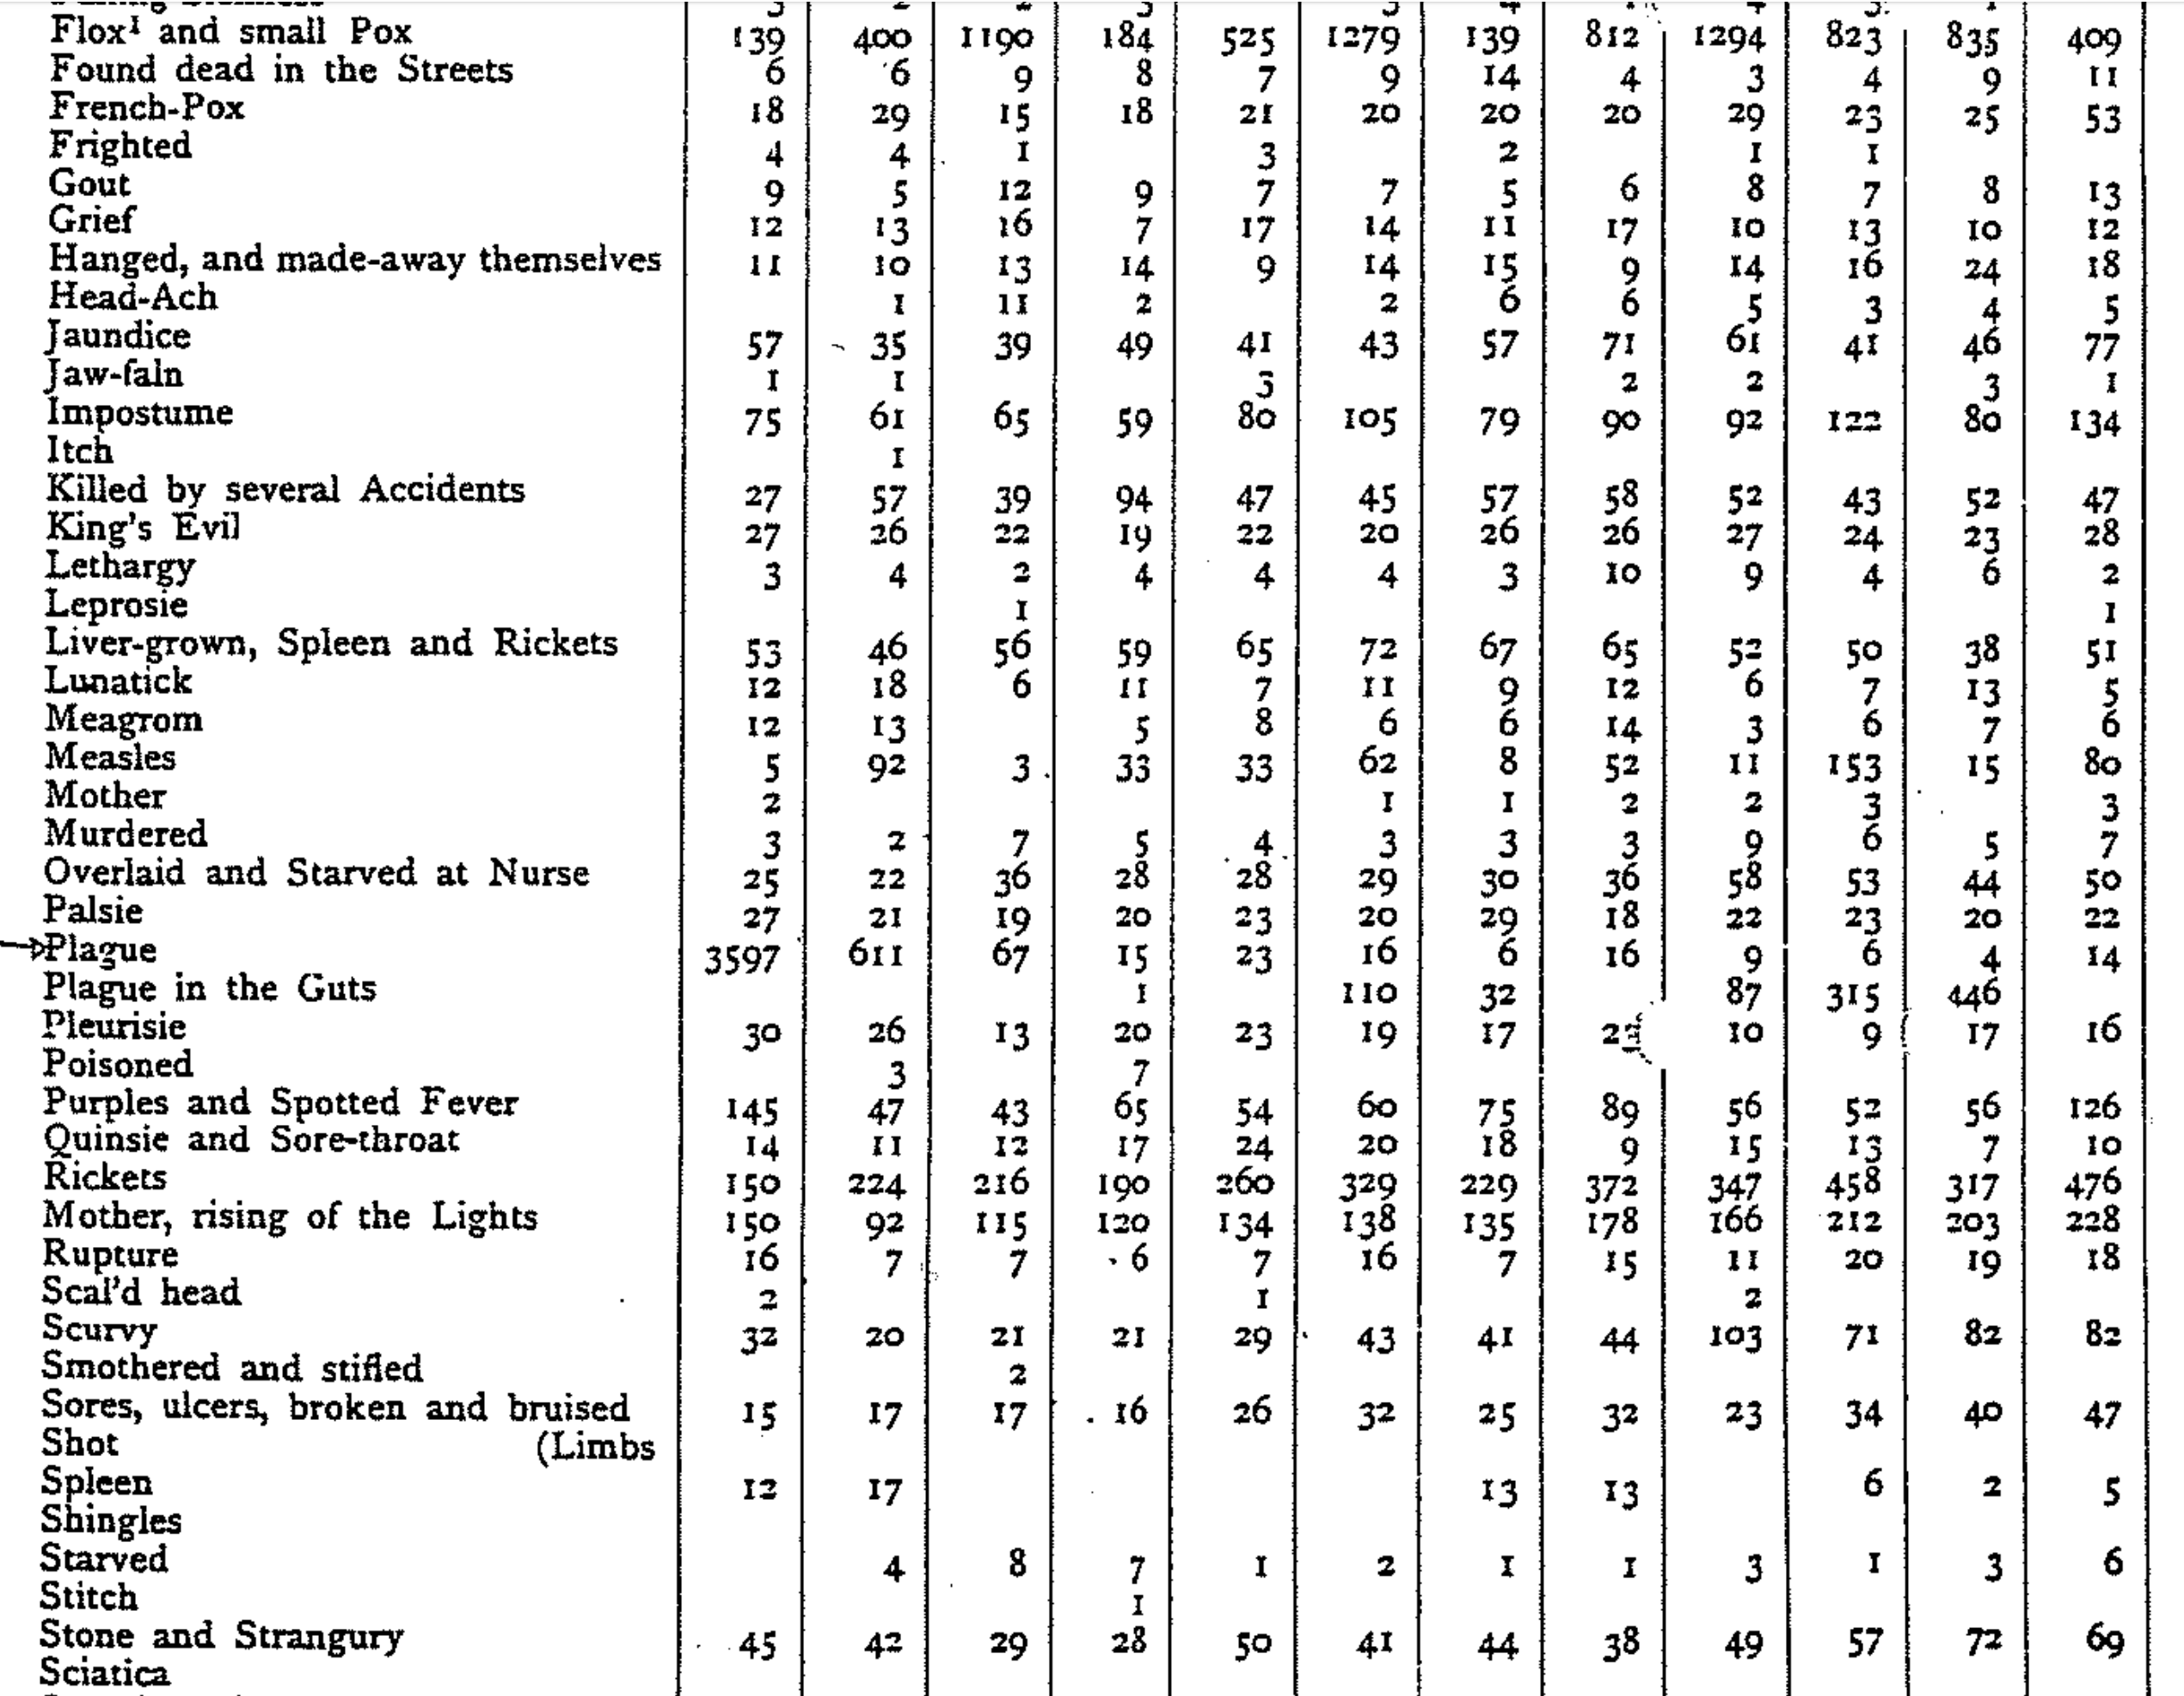
ICD Codes
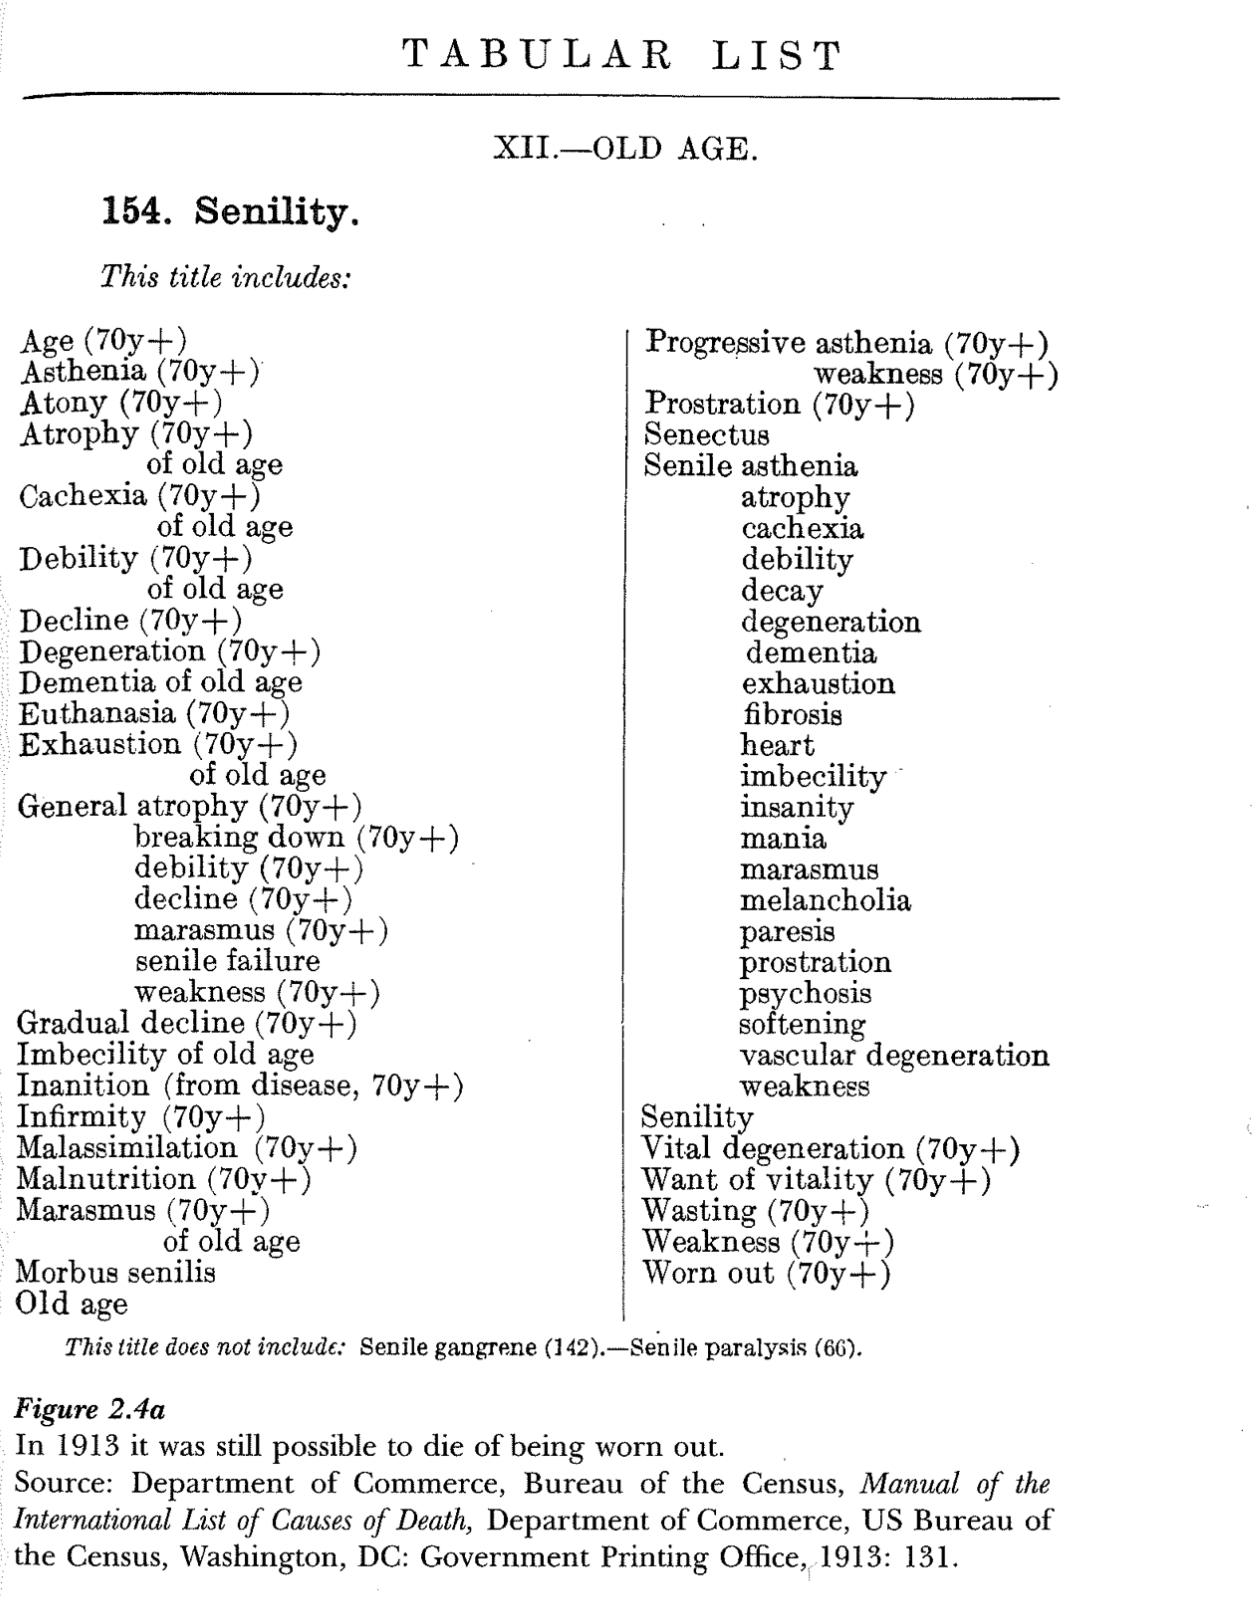
ICD Codes
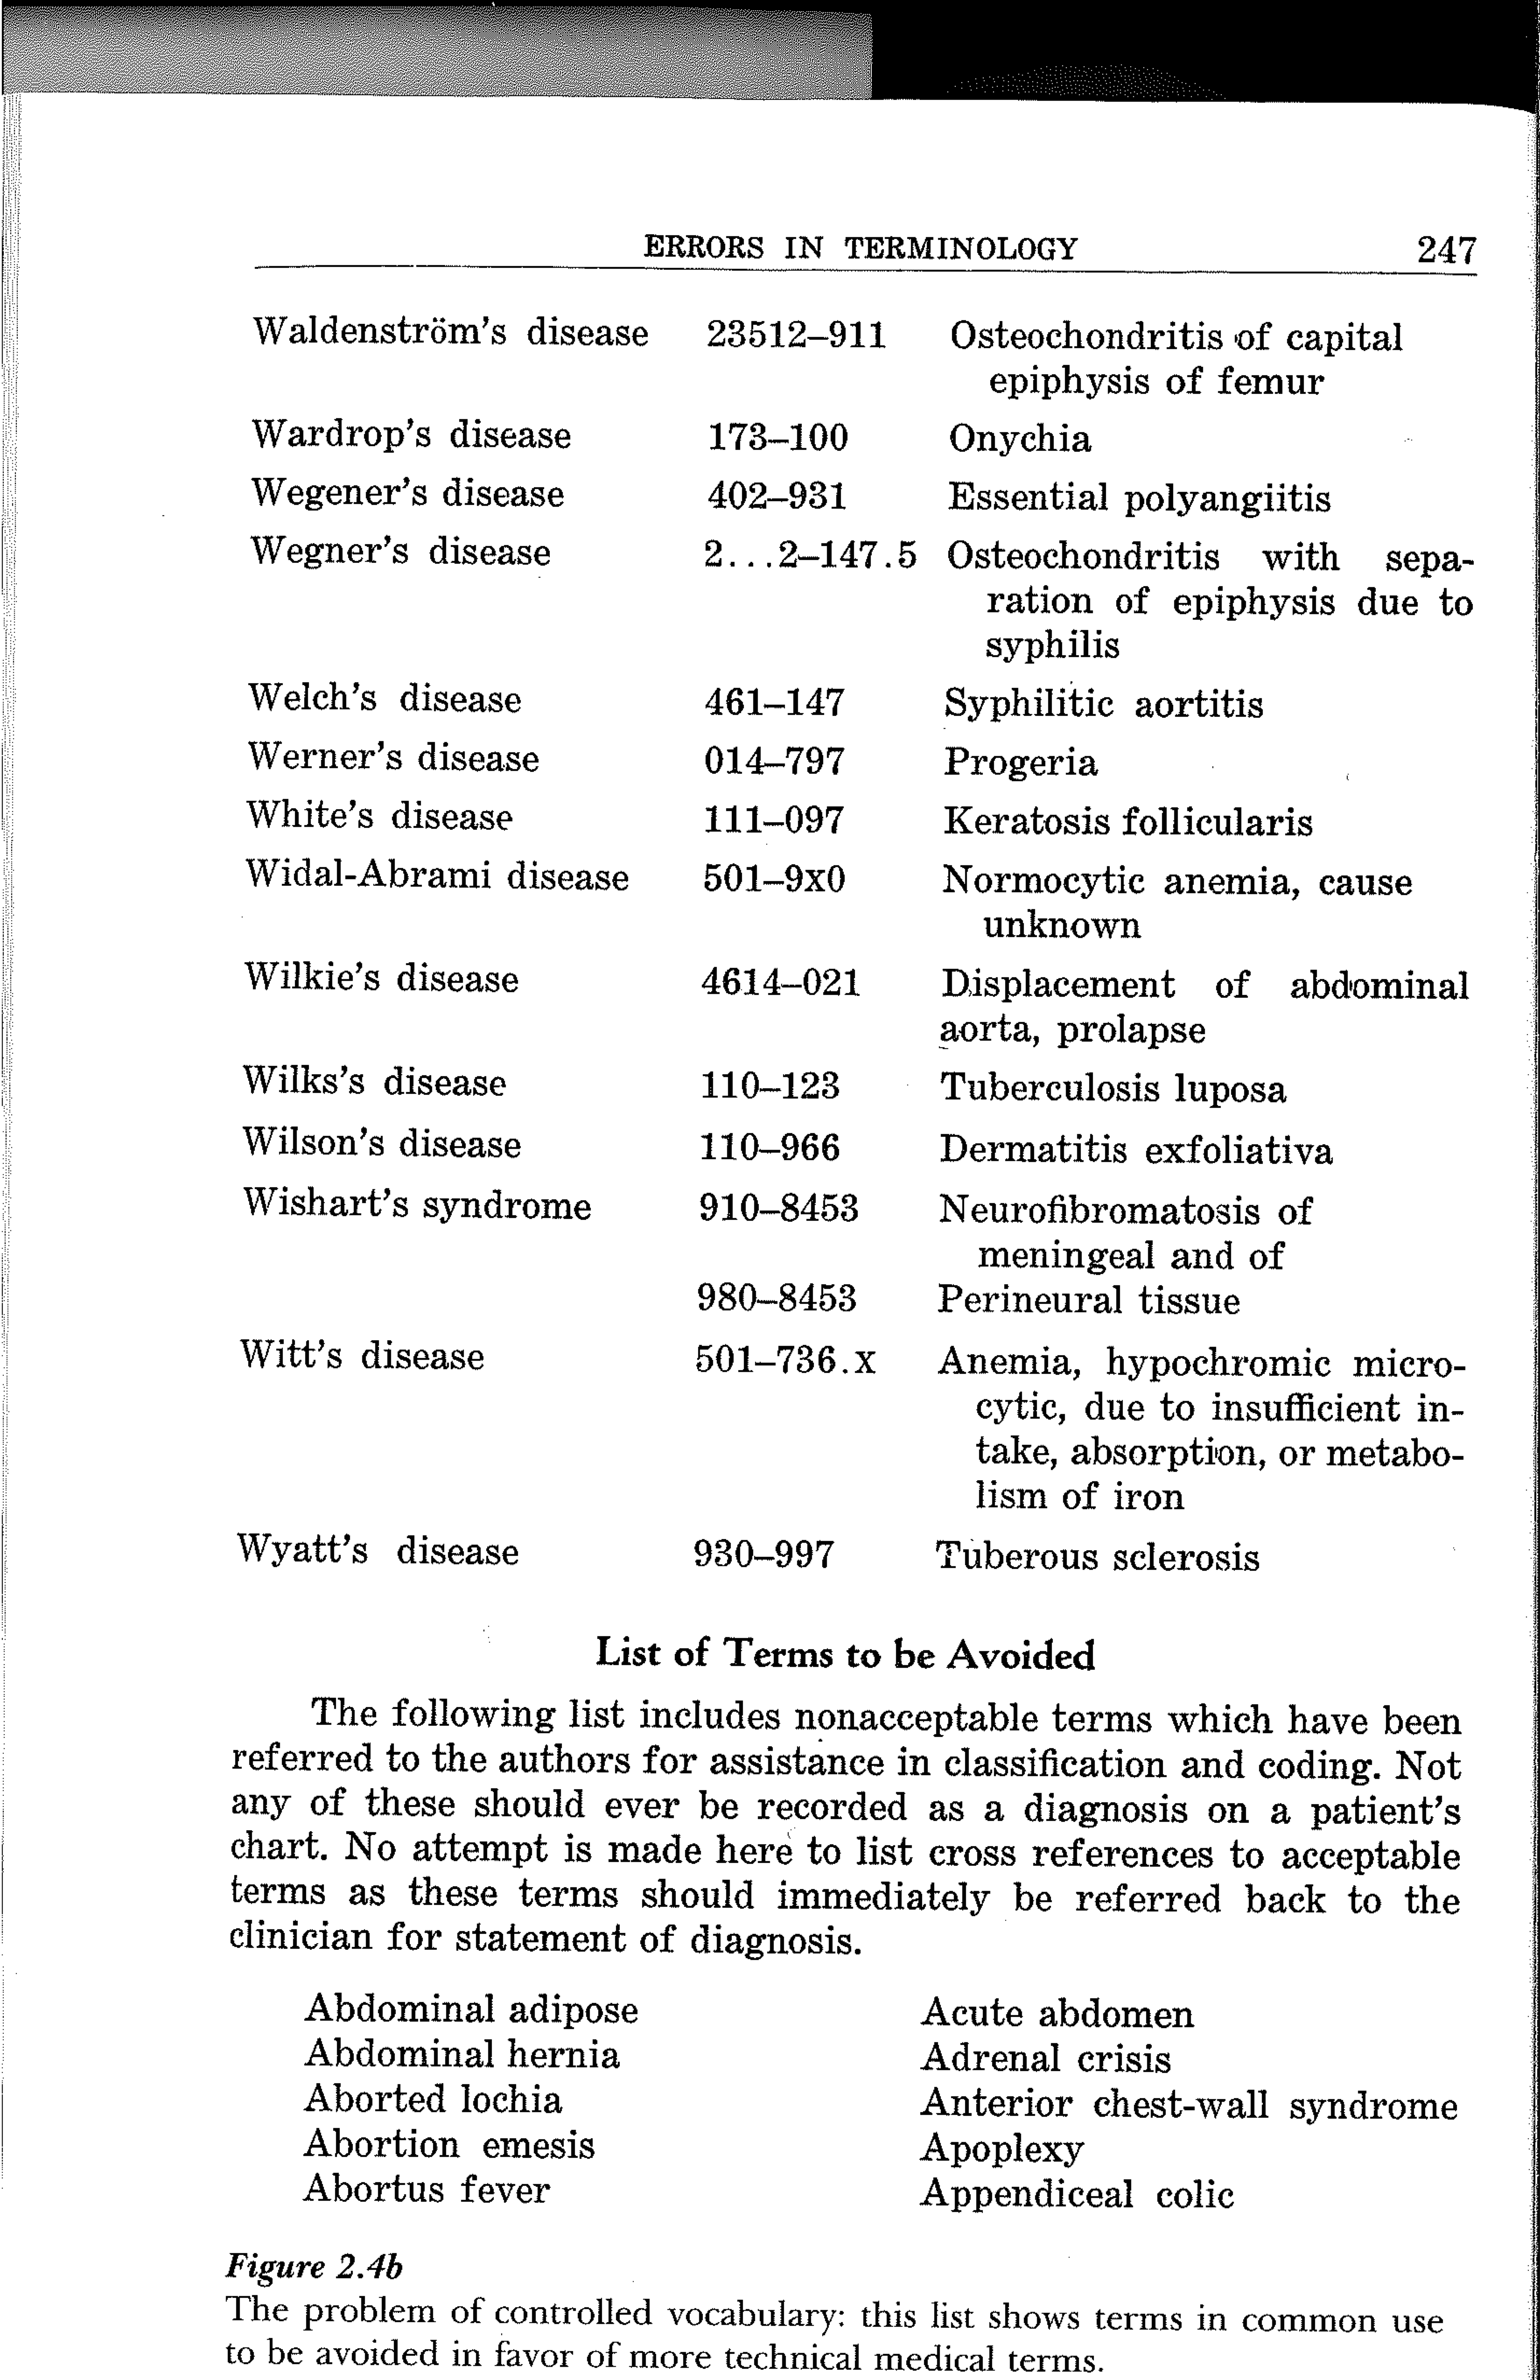
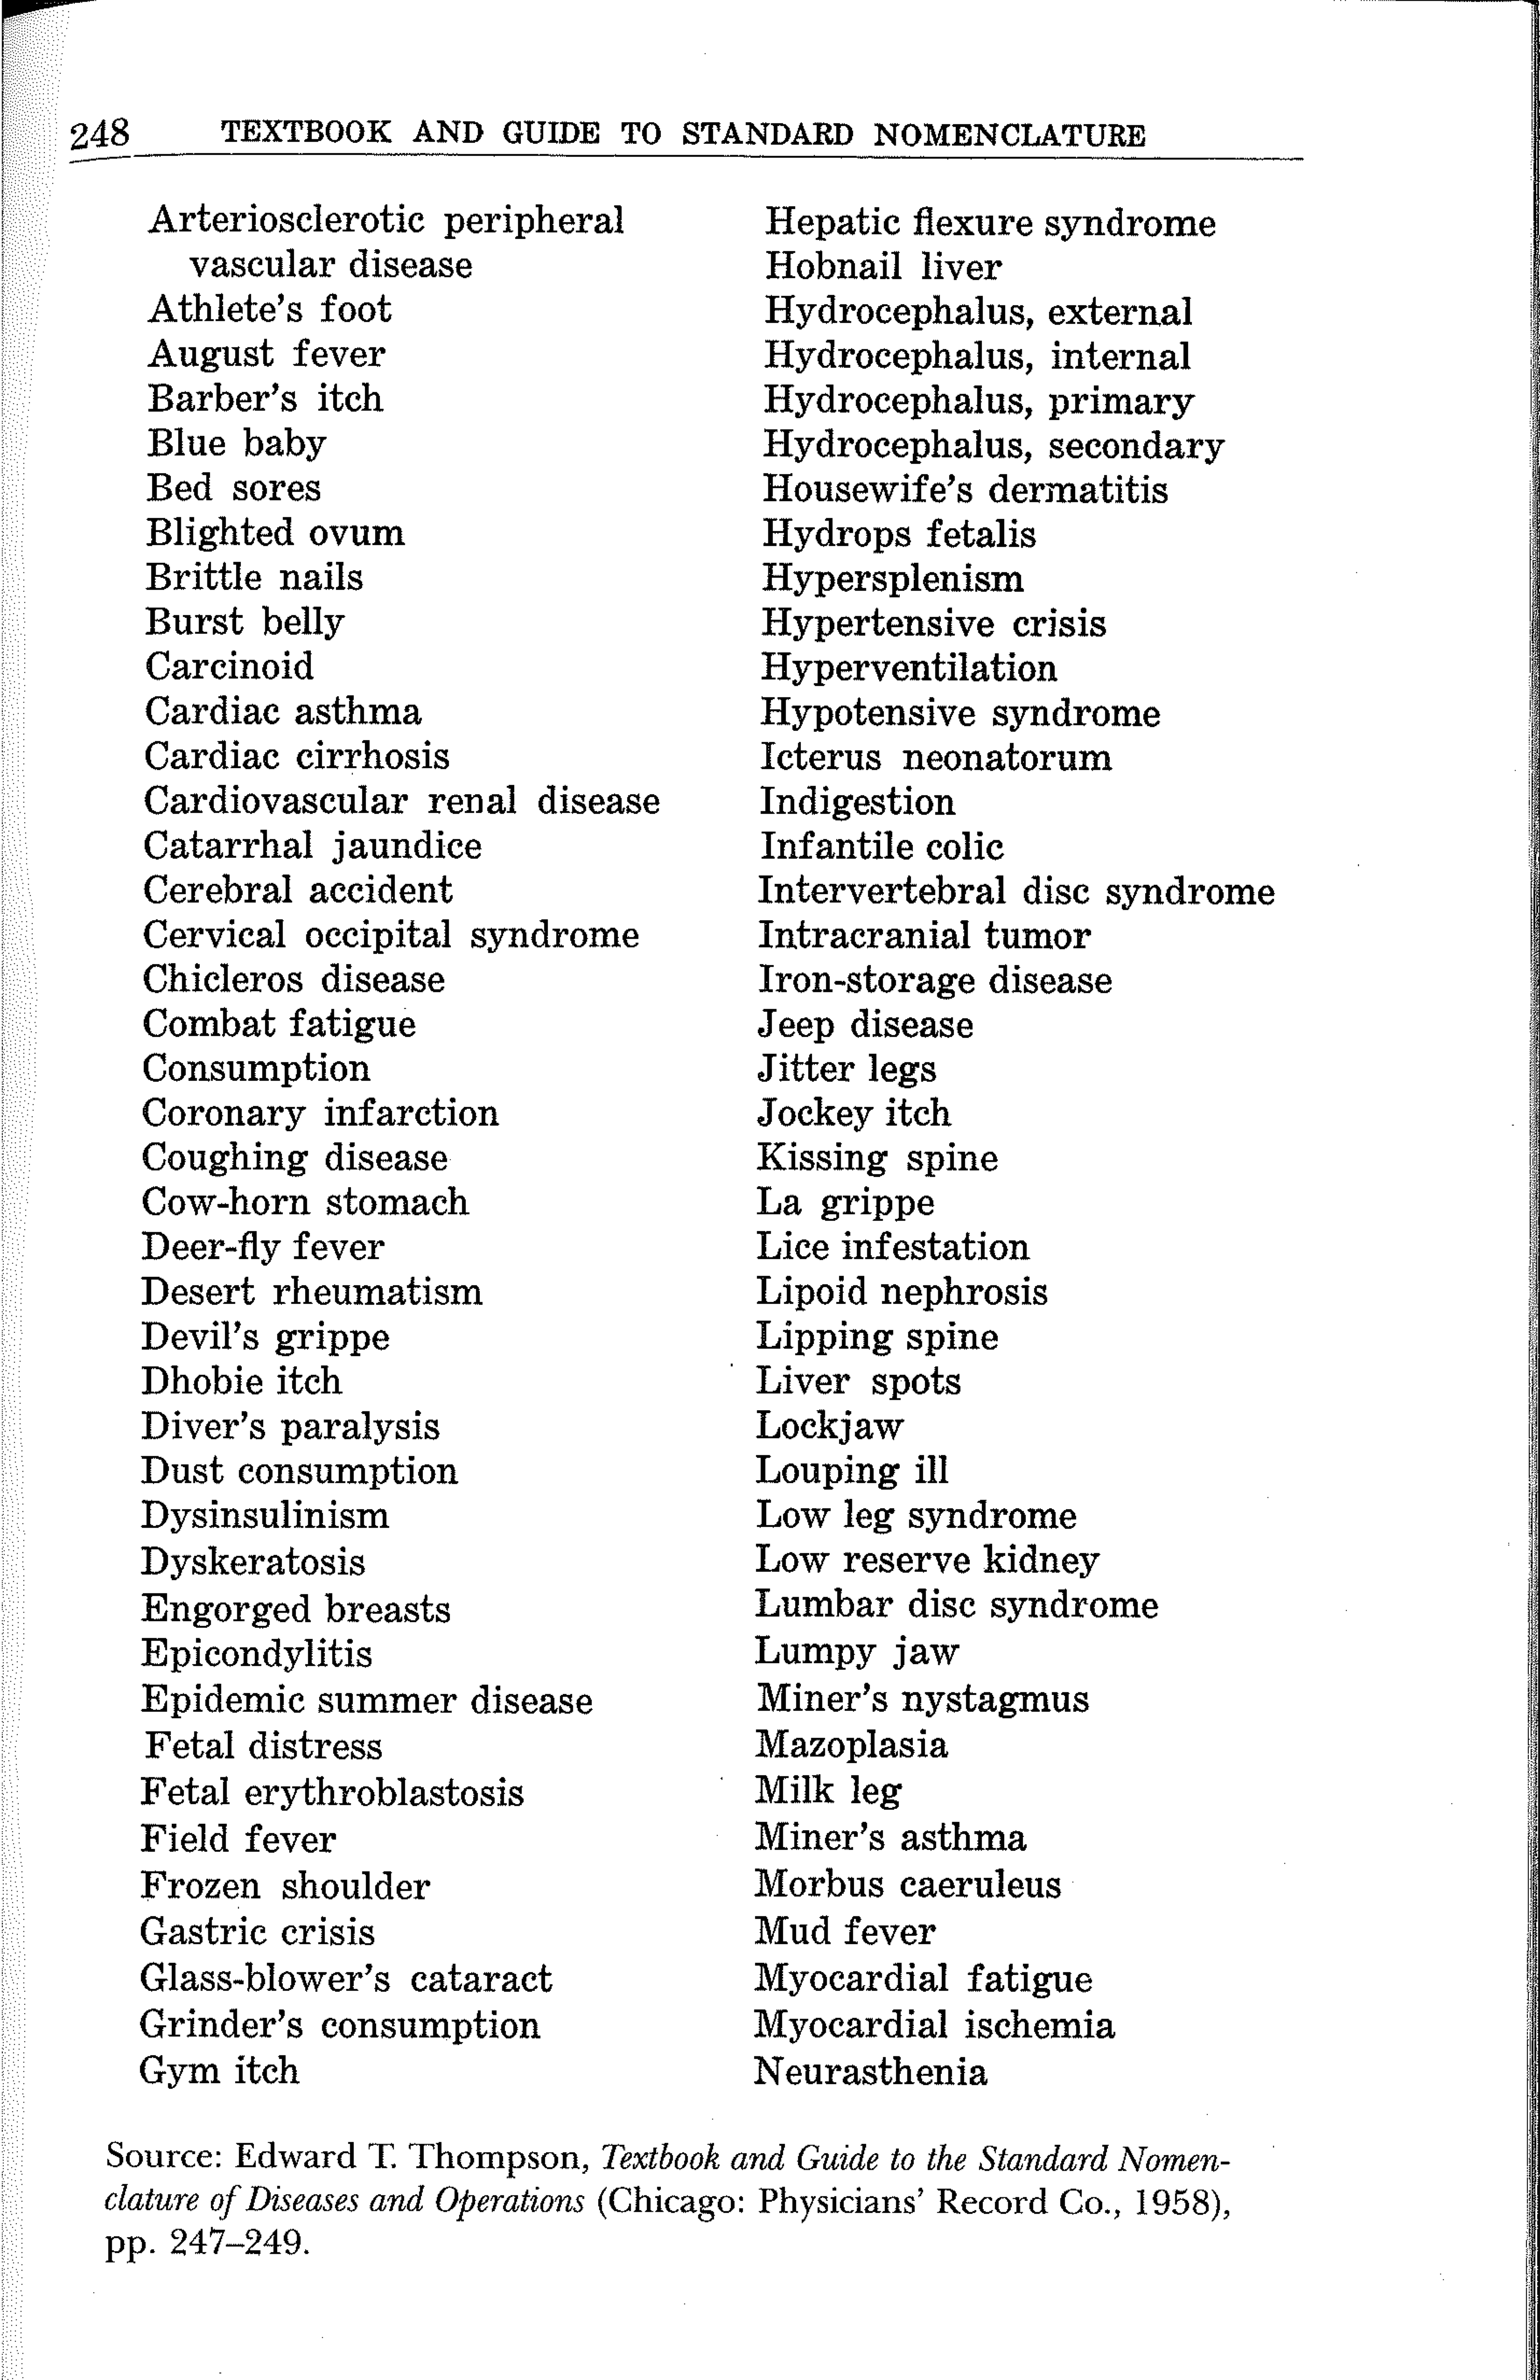
ICD Codes
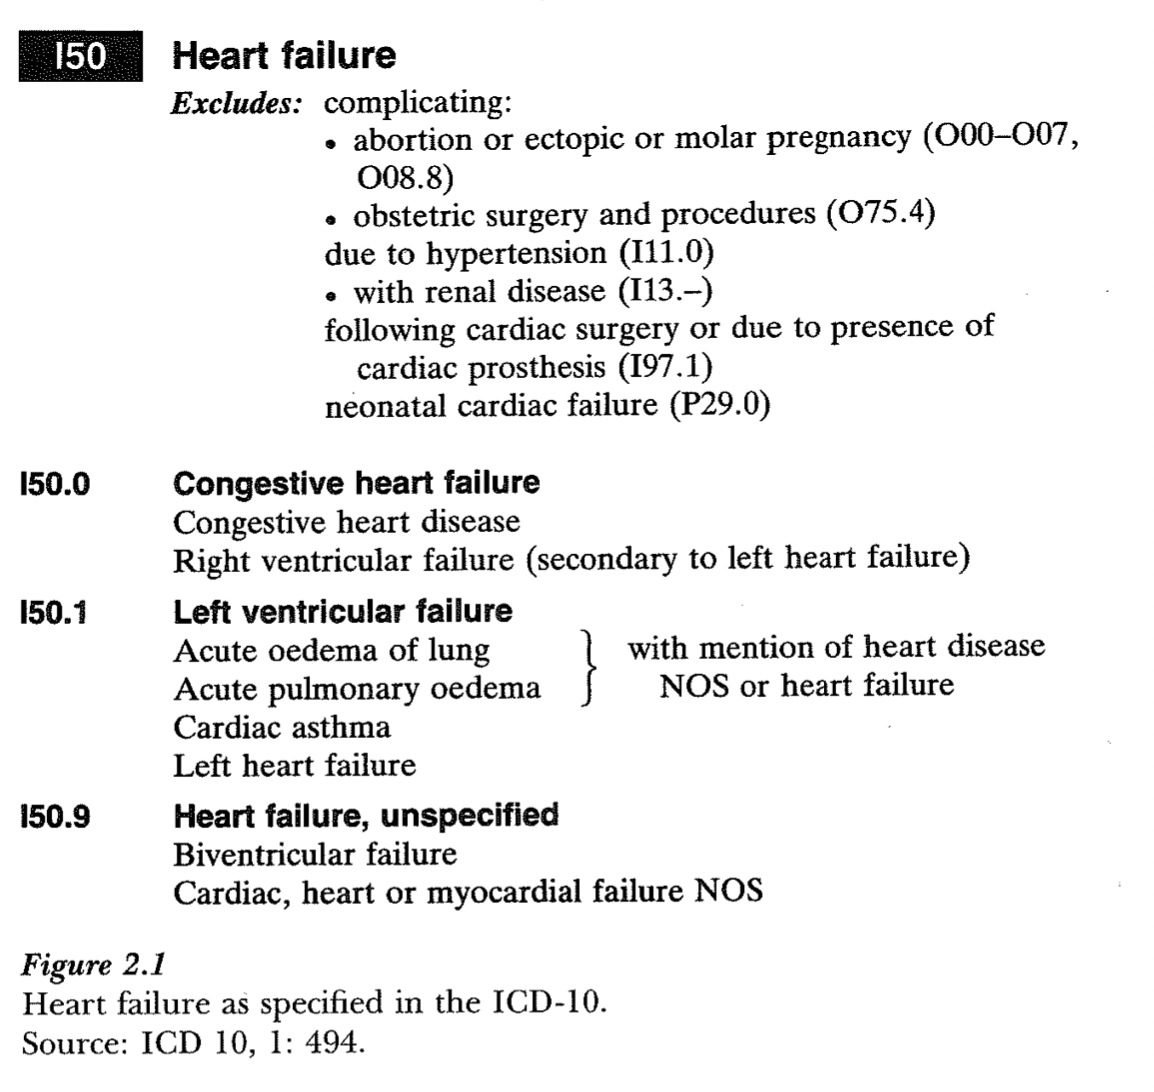
ICD Codes
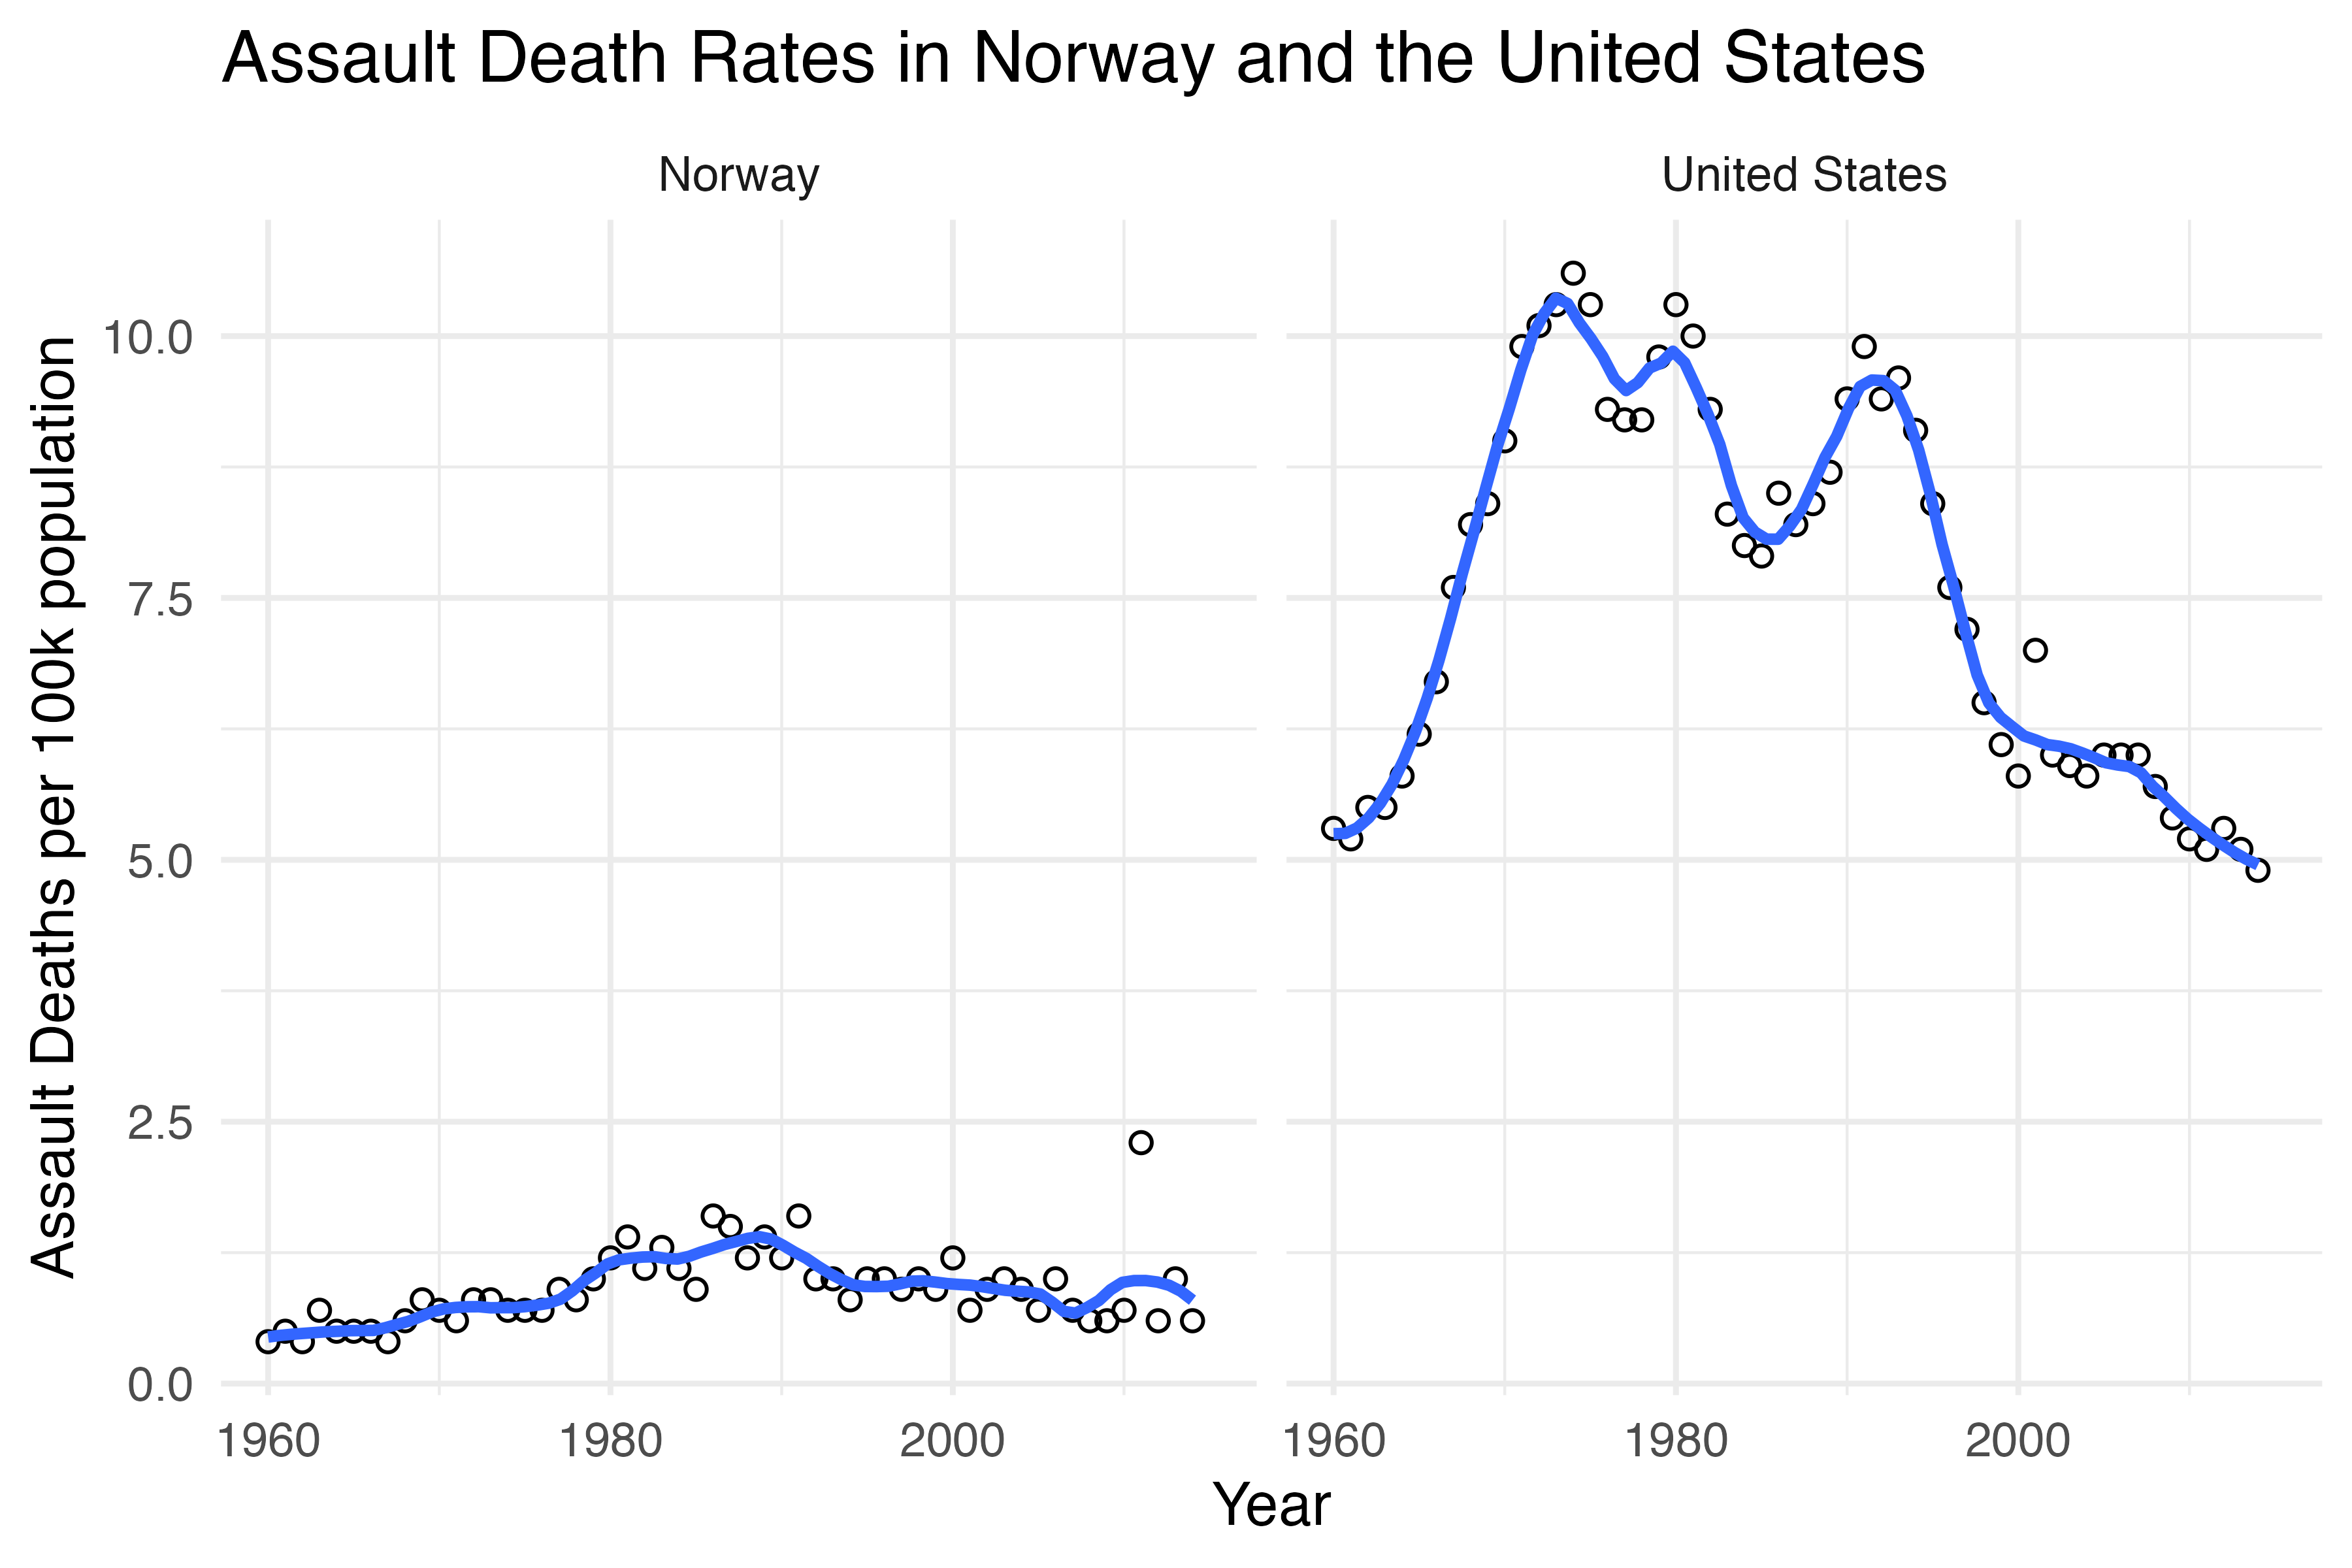
ICD Codes

ICD Codes

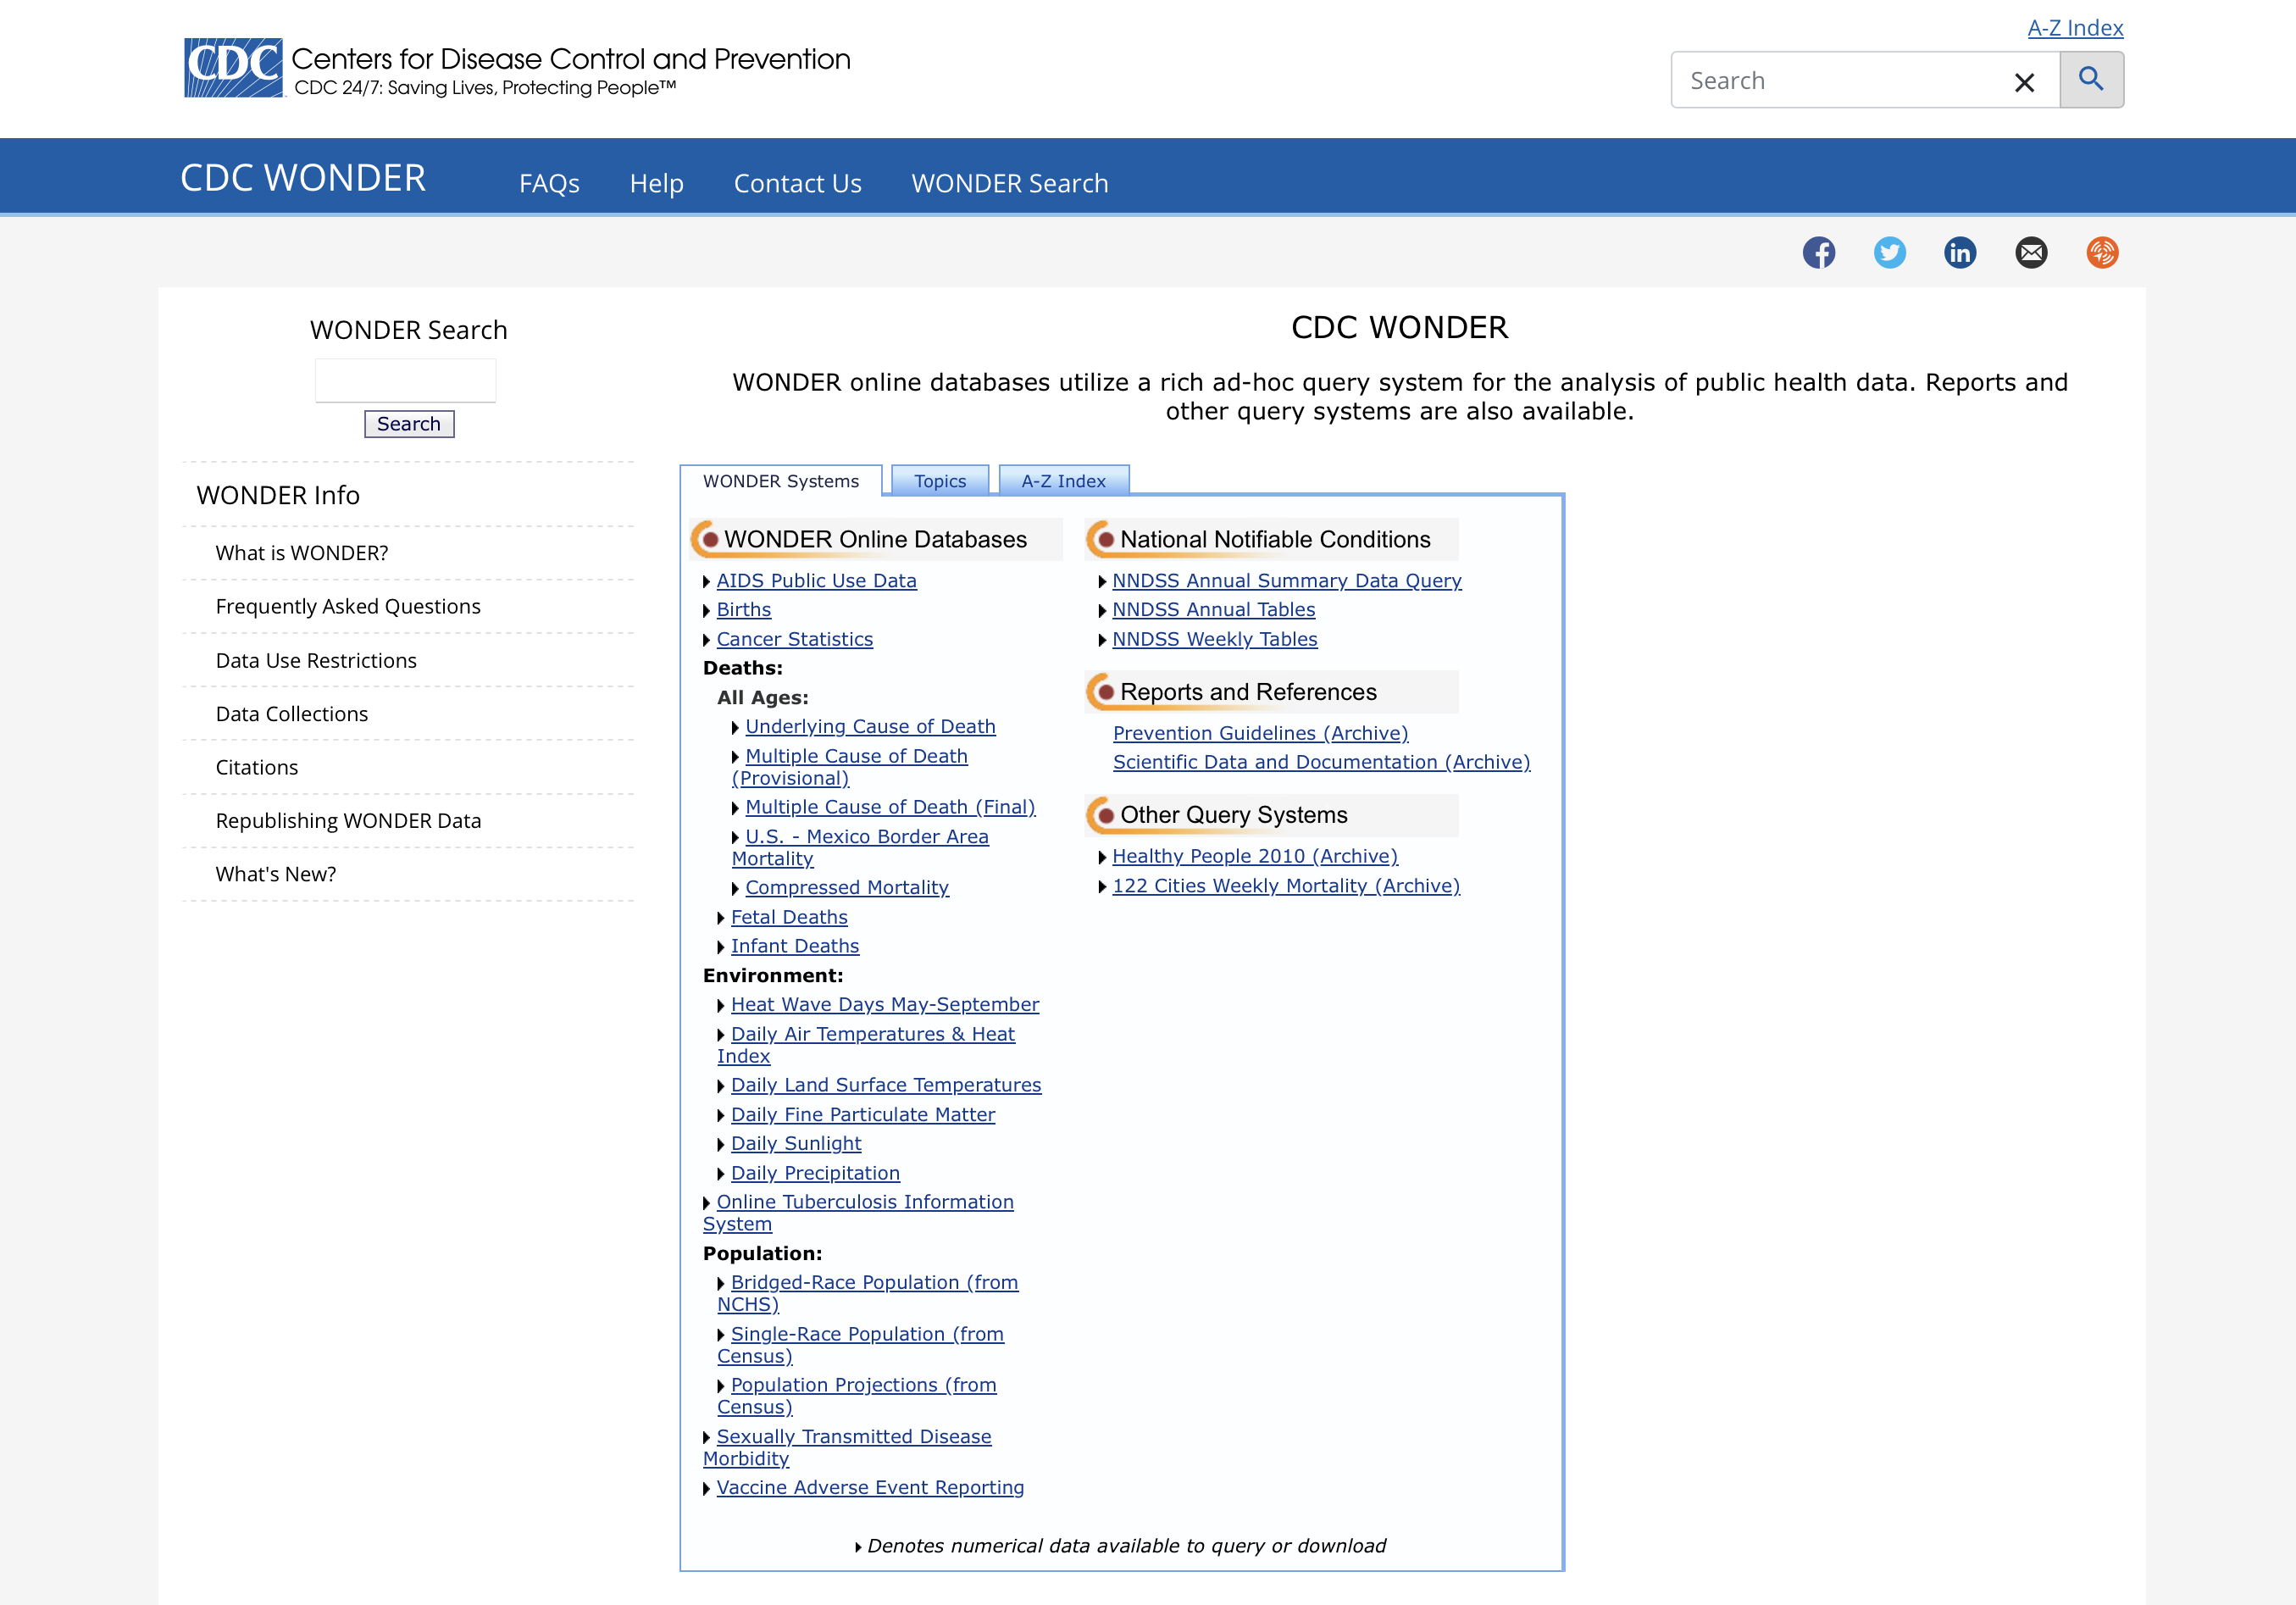
CDC WONDER
Social Classification