library(here)      # manage file paths
library(socviz)    # data and some useful functions
library(tidyverse) # your friend and mine12 — Relational Data (1)
Kieran Healy
January 23, 2024
Relational Data
Load the packages, as always
Specialty packages
Social Relations and Ties
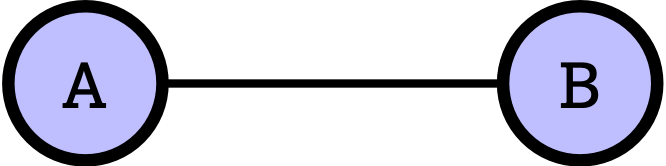
A dyad
Social Relations and Ties
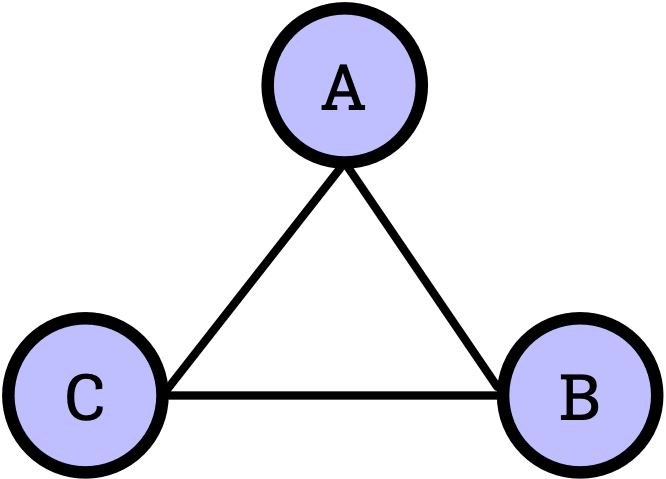
Triads
Centrality in Networks
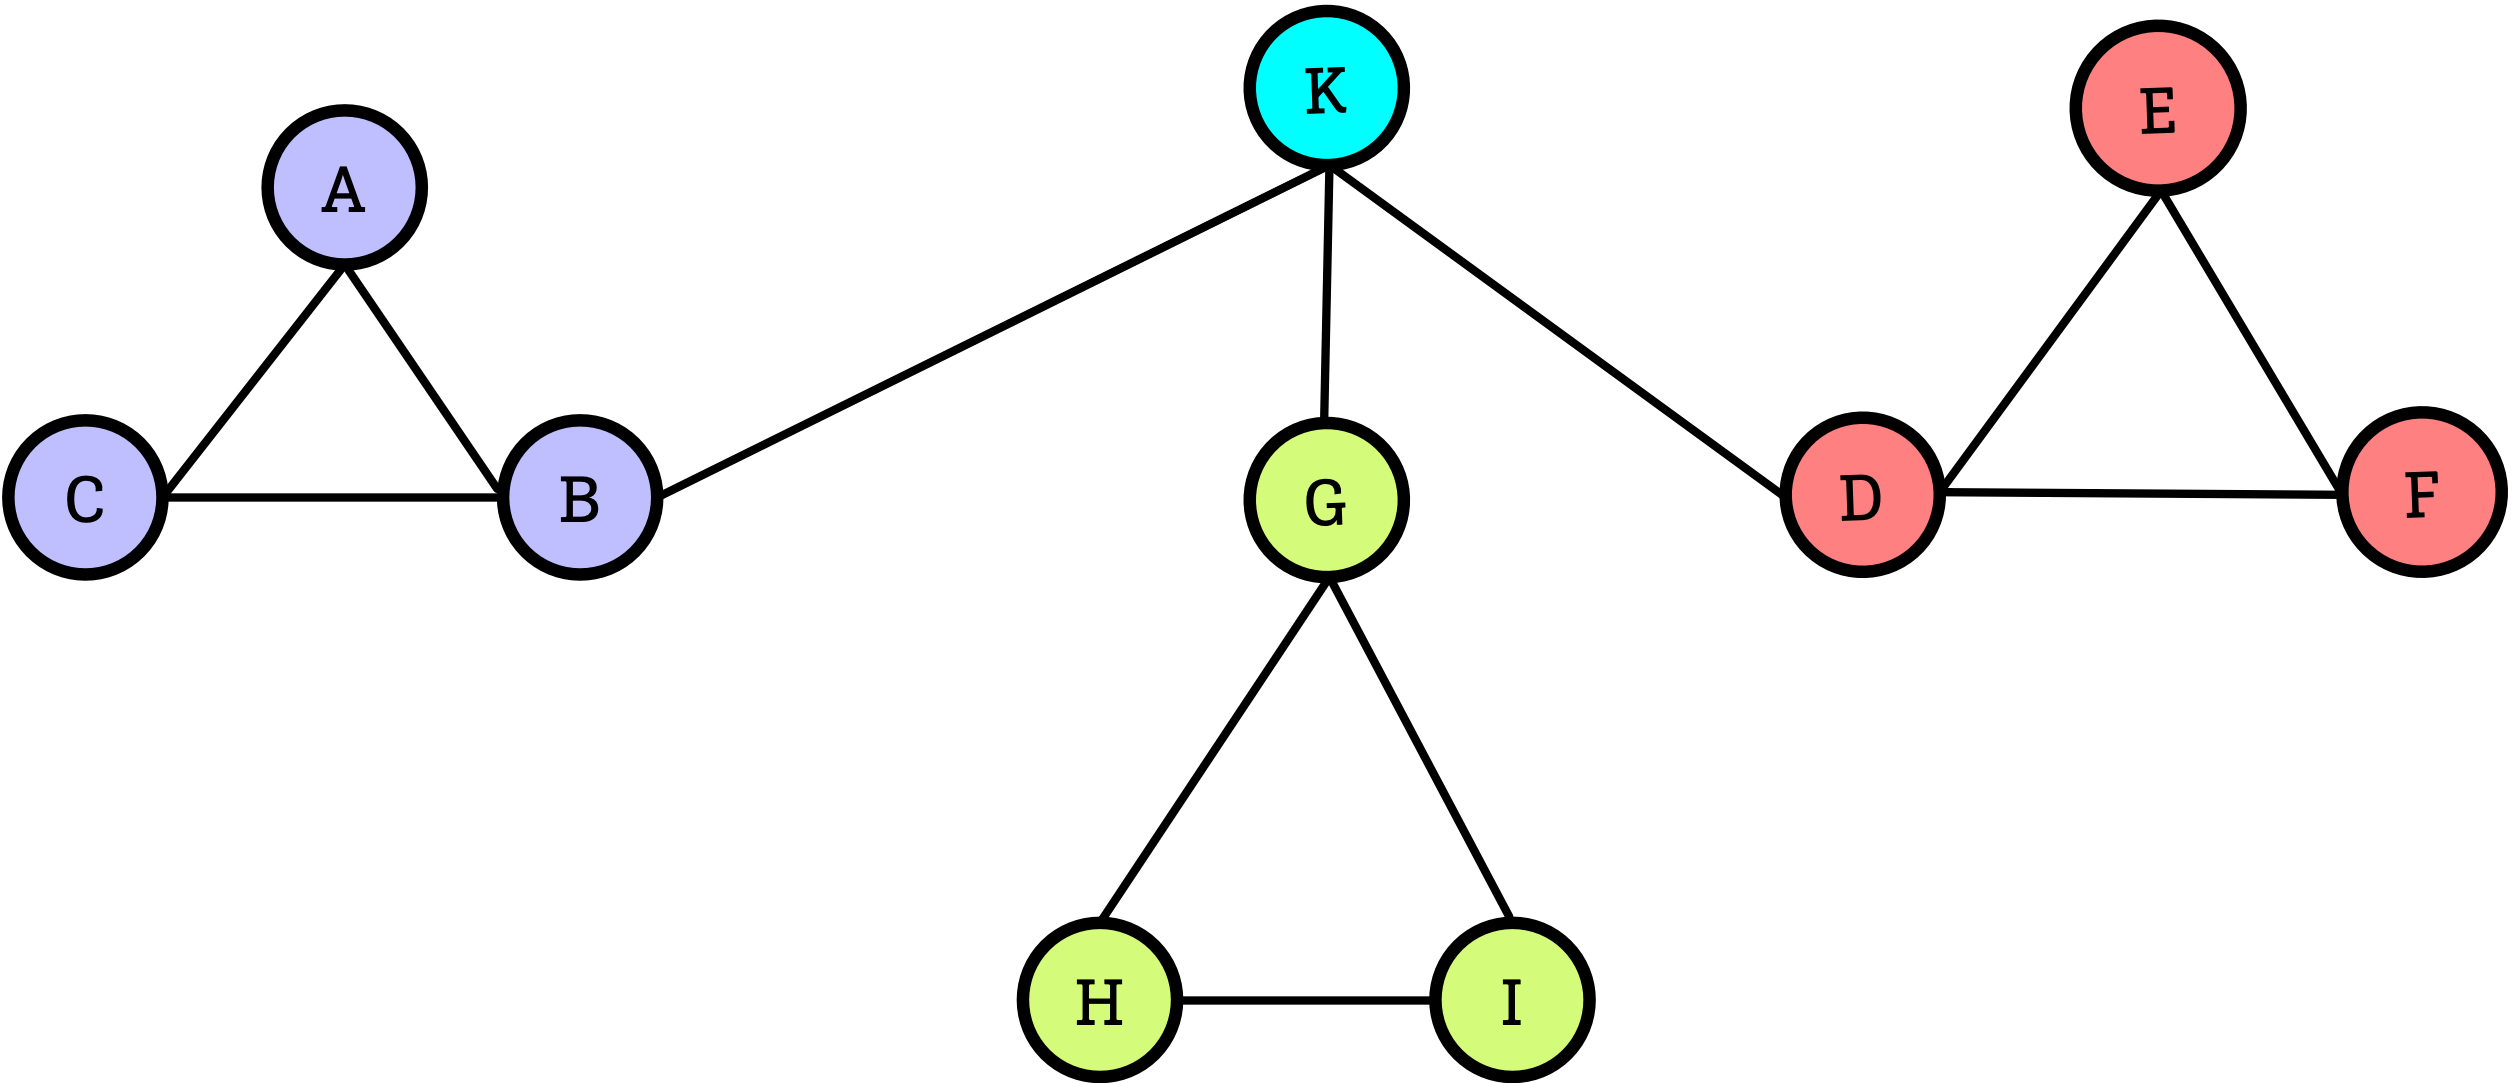
Centrality
Centrality as a kind of power
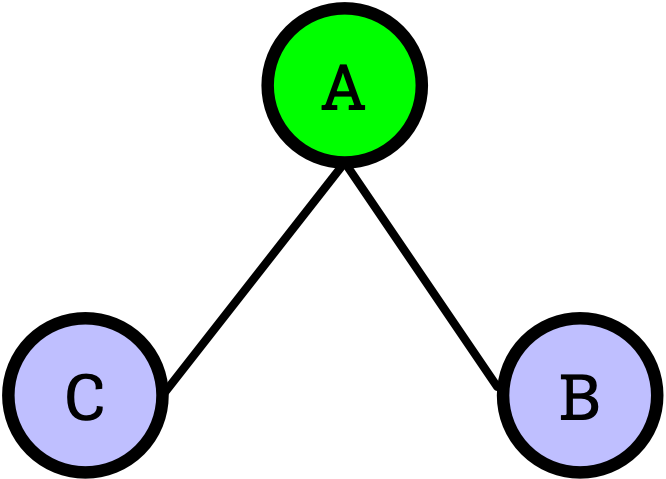
The ‘tertius gaudens’ or ‘laughing third’
Groups and Categories
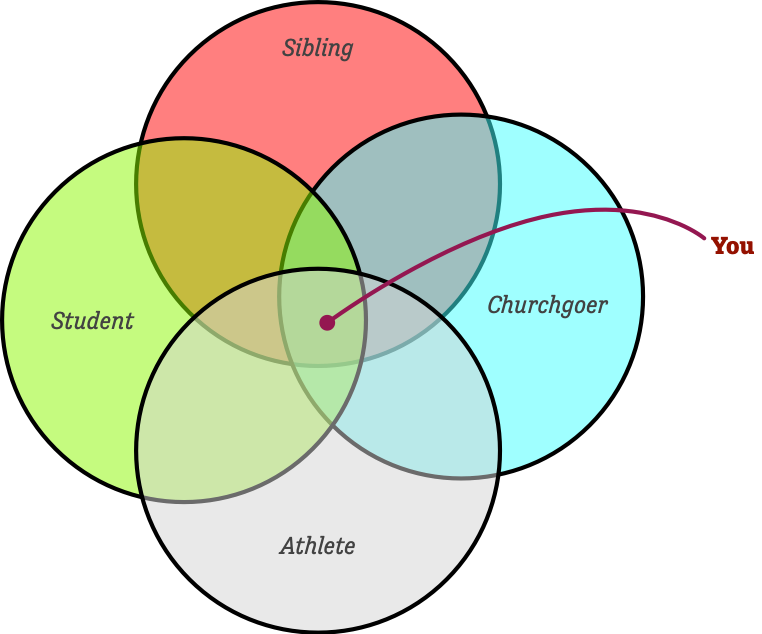
The duality of persons and groups

The Redcoats are coming
Example: Paul Revere
Paul Revere
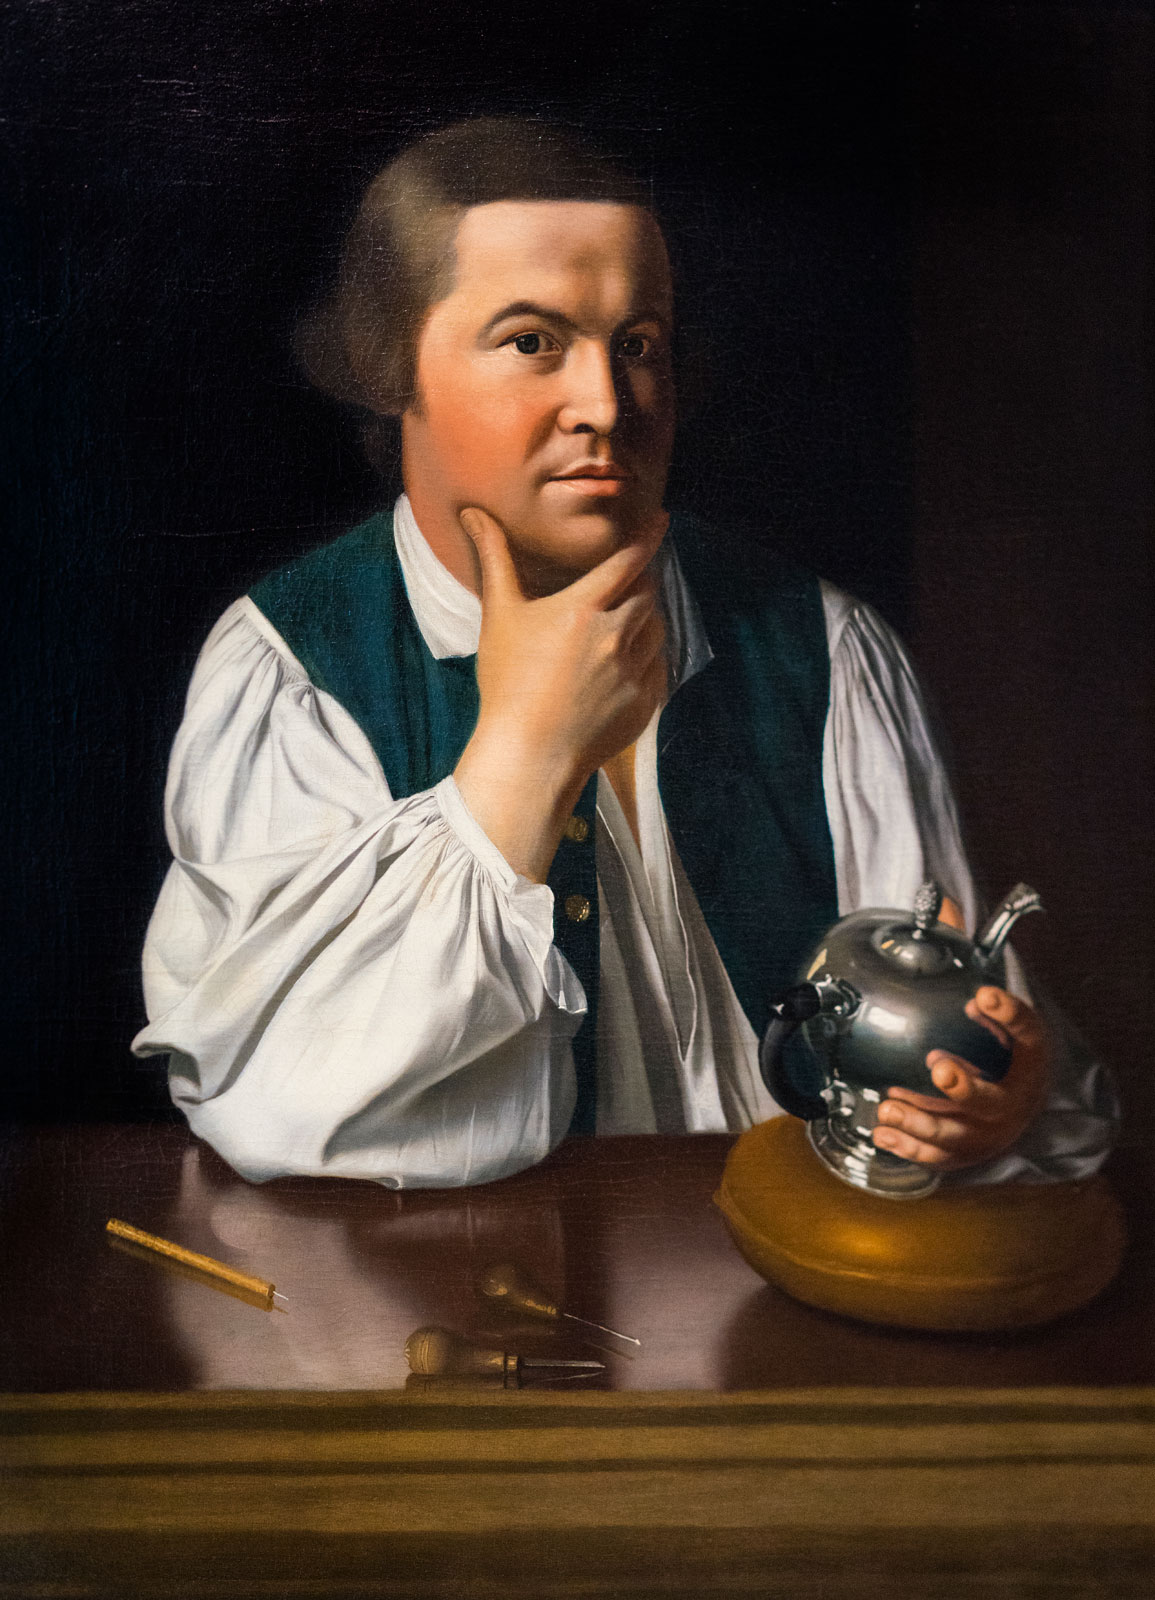
He looks a lot like Jack Black
Paul Revere
- St Andrew’s Lodge
- The Loyal Nine
- Boston North Caucus
- The Long Room Club
- The Tea Party
- The Boston Committee
- The London Enemies List
Paul Revere
7 organizations
254 people
Membership table

This is an adjacency matrix
Membership table … transposed
Flip it on its side
The Duality of Persons and Groups
- People are “connected” by their co-membership in groups
- Groups are “connected” by the people they share
- We can move back and forth between these representations
- Breiger (1974)
Moving between the tables

One way to multiply the matrices
Moving between the tables

And the other way
Paul Revere: Matrix version
              person st_andrews_lodge loyal_nine north_caucus long_room_club
1         Adams.John                0          0            1              1
2       Adams.Samuel                0          0            1              1
3           Allen.Dr                0          0            1              0
4 Appleton.Nathaniel                0          0            1              0
5        Ash.Gilbert                1          0            0              0
6    Austin.Benjamin                0          0            0              0
  tea_party boston_committee london_enemies
1         0                0              0
2         0                1              1
3         0                0              0
4         0                1              0
5         0                0              0
6 0 0 1 person st_andrews_lodge loyal_nine north_caucus long_room_club
249 Willis.Nathaniel 0 0 0 0
250 Wingfield.William 1 0 0 0
251 Winslow.John 0 0 0 1
252 Winthrop.John 0 0 1 0
253 Wyeth.Joshua 0 0 0 0
254 Young.Thomas 0 0 1 0
tea_party boston_committee london_enemies
249 1 0 0
250 0 0 0
251 0 0 0
252 0 0 1
253 1 0 0
254 1 1 0Paul Revere: Matrix version
[1] 254 254 [,1] [,2] [,3] [,4] [,5] [,6] [,7] [,8] [,9] [,10]
[1,] 2 2 1 1 0 0 0 0 0 1
[2,] 2 4 1 2 0 1 1 1 1 1
[3,] 1 1 1 1 0 0 0 0 0 1
[4,] 1 2 1 2 0 0 0 0 0 1
[5,] 0 0 0 0 1 0 0 0 0 0
[6,] 0 1 0 0 0 1 1 1 1 0
[7,] 0 1 0 0 0 1 1 1 1 0
[8,] 0 1 0 0 0 1 1 2 1 0
[9,] 0 1 0 0 0 1 1 1 1 0
[10,] 1 1 1 1 0 0 0 0 0 1Paul Revere: Matrix version
[1] 7 7 st_andrews_lodge loyal_nine north_caucus long_room_club
st_andrews_lodge 53 2 3 2
loyal_nine 2 10 3 0
north_caucus 3 3 59 5
long_room_club 2 0 5 17
tea_party 3 2 13 2
boston_committee 1 0 9 5
london_enemies 3 3 16 5
tea_party boston_committee london_enemies
st_andrews_lodge 3 1 3
loyal_nine 2 0 3
north_caucus 13 9 16
long_room_club 2 5 5
tea_party 97 3 8
boston_committee 3 21 11
london_enemies 8 11 62Making this tidier
- Network matrices get really large really fast
- They’re also usually very sparse
- We can’t store this data tidily in a single table
- But we can with two tables.
tidygraphdoes this for us.
Paul Revere: Tidy version
# A tbl_graph: 7 nodes and 49 edges
#
# An undirected multigraph with 1 component
#
# Node Data: 7 × 2 (active)
     id name
  <int> <chr>
1     1 st_andrews_lodge
2     2 loyal_nine
3     3 north_caucus
4     4 long_room_club
5     5 tea_party
6     6 boston_committee
7     7 london_enemies
#
# Edge Data: 49 × 3
   from    to value
  <int> <int> <dbl>
1     1     1    53
2     1     2     2
3     1     3     3
# ℹ 46 more rows
Paul Revere: Tidy version

Paul Revere: Tidy version
- The person x person network
out <-  revere_persons |>
  mutate(centrality = centrality_eigen()) |>
  ggraph(layout = "stress") +
  geom_edge_link0(aes(edge_width = value), color = "gray60") +
  scale_edge_width(range = c(0.02, 2))+
  geom_node_point() +
  geom_node_label(aes(filter = centrality > 0.9, label = name), size = rel(2.5)) +
  theme_graph()
Social Relations and Ties