Problem set 01
Due by
Task 1: Get up and running with R, RStudio, and the Tidyverse
The first thing we need to do is install the tools we’ll be using. We’ll follow the steps in Example 01 in class.
Task 2: Get introduced to R and RStudio
R is a programming language and environment for statistical computing. RStudio is an integrated development environment, or IDE for R. It is an application that acts as a kind of staging zone for the various related things you have to do when doing data analysis with R. It lets you type and save code in scripts or documents, run that code in R itself, see the results of what you have written, and manage various other tasks.
The best way to get started is to jump in directly. Read and follow along with Chapters 1 and 2 of Wickham et al’s R for Data Science.
Task 3: RStudio projects
For today, and for most of our problem sets, we will start with a zipped (i.e. compressed) file containing a project that has been mostly prepared in advance for you.
Click the button above to download the project. Unzip it, and double-click the file named 01-problem-set.Rproj to launch a new instance of RStudio. In RStudio, open the file named analysis.qmd and render it. Read the qmd file and compare it to its output.
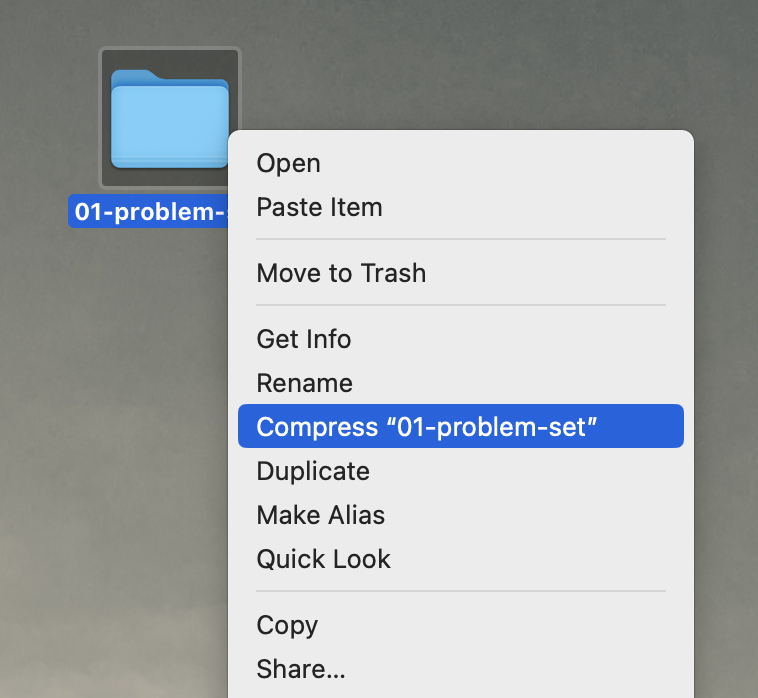
WHEN YOU ARE DONE with the problem set, zip up the problem set folder and submit it as the Week 1 assignment on Canvas.
- On Mac OS, in the Finder, select the folder, right click (that is, hold down the Control key and click), and choose “Compress”
- On Windows, Locate the file or folder that you want to zip. Press and hold (or right-click) the file or folder, select (or point to) Send to, and then select Compressed (zipped) folder. A new zipped folder with the same name is created in the same location.
Then upload the zipped file to Canvas.
Task 4: Getting familiar with Quarto and RMarkdown
To ensure that the analysis and graphics you make are reproducible, you’ll do the majority of your work in this class using Quarto documents. Watch this video, maybe more than once: