Code
letters [1] "a" "b" "c" "d" "e" "f" "g" "h" "i" "j" "k" "l" "m" "n" "o" "p" "q" "r" "s"
[20] "t" "u" "v" "w" "x" "y" "z"This section contains worked examples in R together with supplementary information that will be useful as you work on your problem sets and project. Examples are listed in the menu on the left. You will see both chunks of code and the output the code produces as well. For example:
letters [1] "a" "b" "c" "d" "e" "f" "g" "h" "i" "j" "k" "l" "m" "n" "o" "p" "q" "r" "s"
[20] "t" "u" "v" "w" "x" "y" "z"The code comes first, the output comes second.
length(letters)[1] 26letters |>
length() |>
sqrt()[1] 5.09902The same goes for graphs. E.g.,
library(ggplot2)

palmerpenguins::penguins |>
  ggplot(mapping = aes(x = body_mass_g,
                       y = bill_length_mm,
                       color = species)) +
  geom_point() +
  labs(title = "Bill length vs Body mass by Species")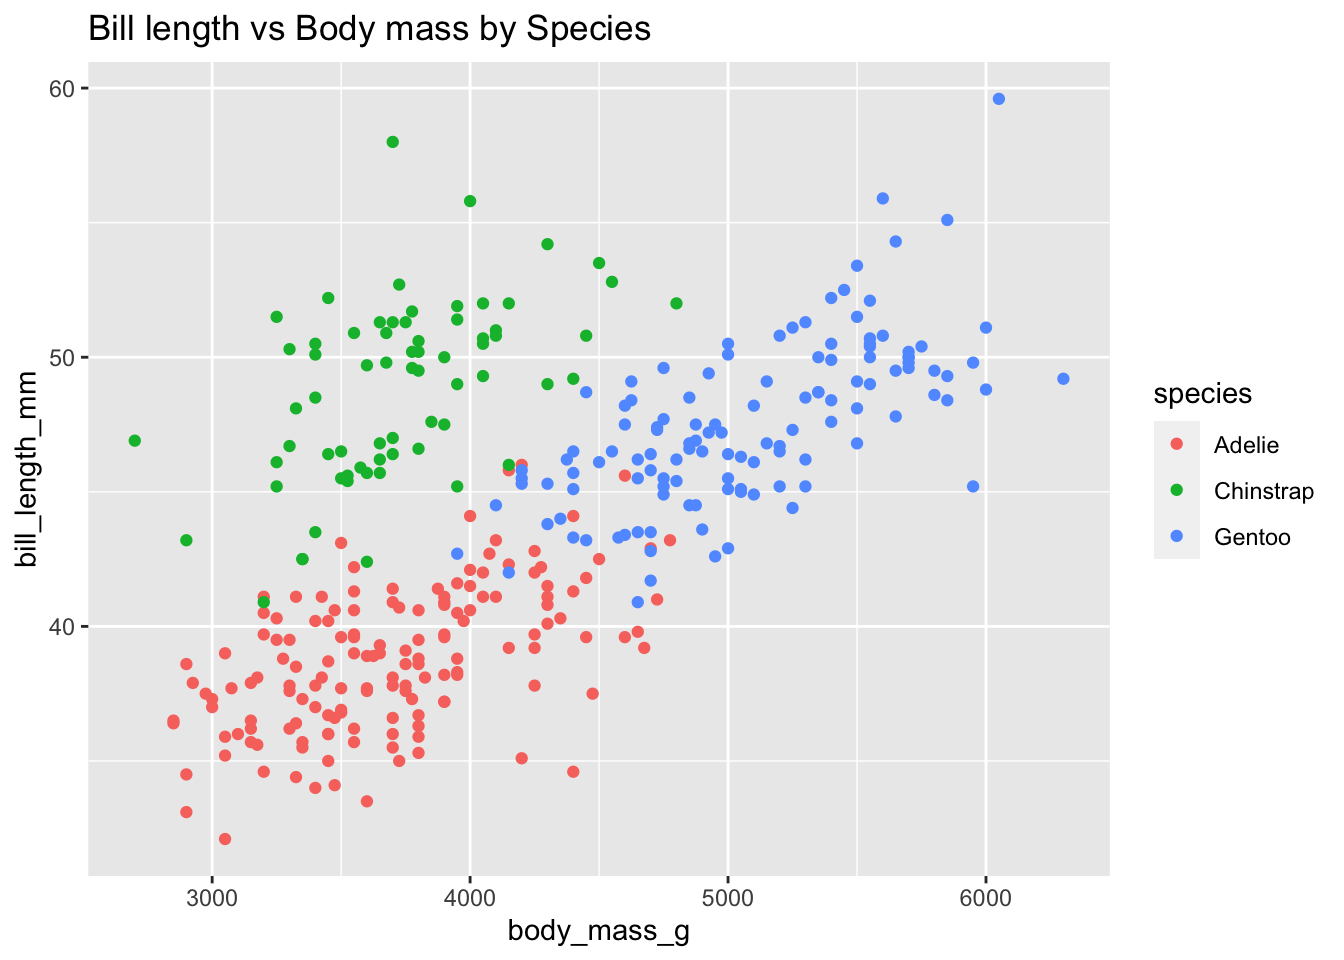
You can copy the code used in these examples in one of two ways. First, you can mouse over any code chunk and click the clipboard icon, , that appears.
Second, you can scroll to the top of your screen. You will see “</> Code” written in gray in the right corner. If you click that, you will get a little menu that allows you to hide or show all the code chunks on an example page, and also copy the code for the entire page.