── Conflicts ────────────────────────────────────────── tidyverse_conflicts() ──
✖ dplyr::filter() masks stats::filter()
✖ dplyr::lag()    masks stats::lag()
ℹ Use the conflicted package (<http://conflicted.r-lib.org/>) to force all conflicts to become errors
Code
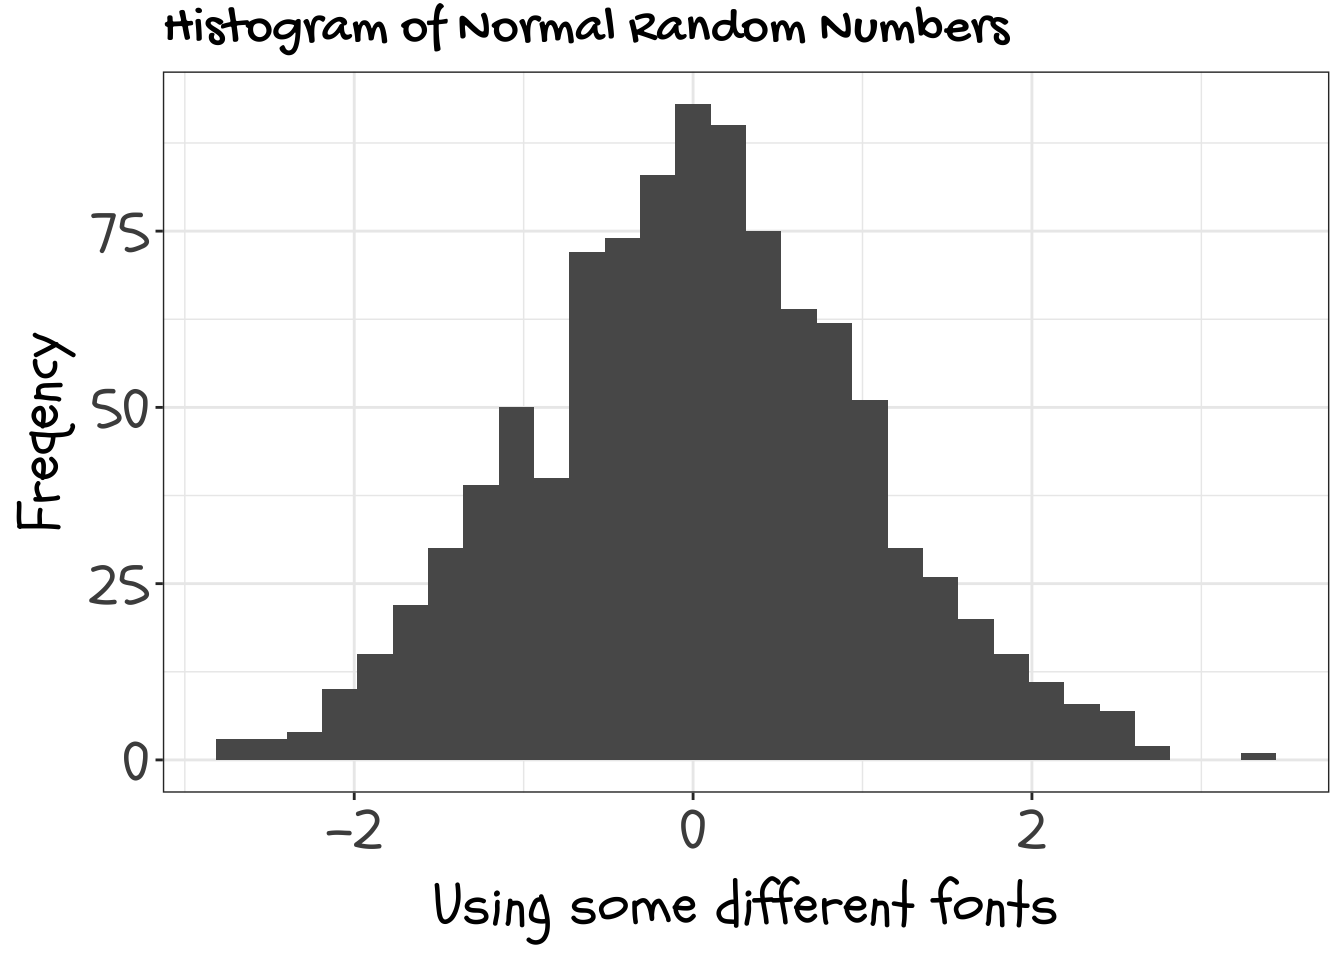
# install.packages("showtext")
library(showtext) # Incorporate system and google fonts into your graphs
## Loading Google fonts (https://fonts.google.com/)font_add_google("Gochi Hand", "gochi")font_add_google("Schoolbell", "bell")## Automatically use showtext to render textshowtext_auto()set.seed(123)df <-tibble(x =rnorm(1000))ggplot(df, mapping =aes(x = x)) +geom_histogram() +labs(title ="Histogram of Normal Random Numbers", y ="Freqency", x ="Using some different fonts") +theme_bw() +theme(plot.title =element_text(family ="gochi", size =rel(1.8)), axis.text =element_text(family ="bell", size =rel(2)), axis.title =element_text(family ="bell", size =rel(2)))
`stat_bin()` using `bins = 30`. Pick better value with `binwidth`.
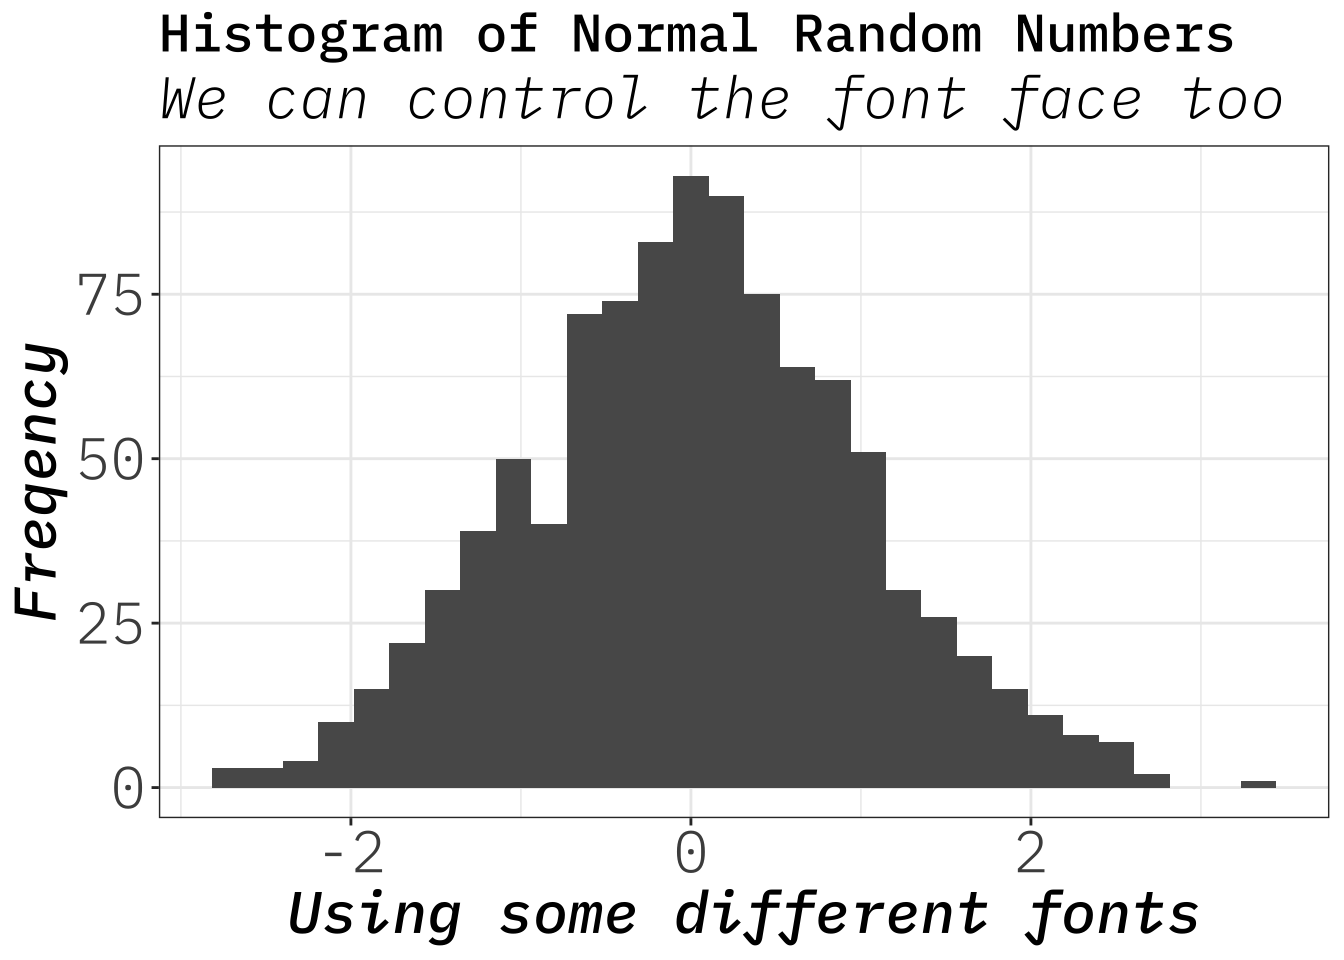
font_add(family ="IBM Plex Mono", regular ="~/Library/Fonts/IBMPlexMono-Light.otf", bold ="~/Library/Fonts/IBMPlexMono-Medium.otf",italic ="~/Library/Fonts/IBMPlexMono-LightItalic.otf",bolditalic ="~/Library/Fonts/IBMPlexMono-MediumItalic.otf")ggplot(df, mapping =aes(x = x)) +geom_histogram() +labs(title ="Histogram of Normal Random Numbers", subtitle ="We can control the font face too",y ="Freqency", x ="Using some different fonts") +theme_bw() +theme(plot.title =element_text(family ="IBM Plex Mono", face ="bold", size =rel(1.8)), plot.subtitle =element_text(family ="IBM Plex Mono", face ="italic", size =rel(2)),# ggplot calls 'regular' 'plain'axis.text =element_text(family ="IBM Plex Mono", face ="plain", size =rel(2)), # Watch out for annoying but required period in bold.italicaxis.title =element_text(family ="IBM Plex Mono", face ="bold.italic", size =rel(2)))
`stat_bin()` using `bins = 30`. Pick better value with `binwidth`.
Source Code
---title: "Example 13: Fonts"---## Setup```{r}library(here) # manage file pathslibrary(socviz) # data and some useful functionslibrary(tidyverse) # your friend and mine# install.packages("showtext") library(showtext) # Incorporate system and google fonts into your graphs```## Basic operation```{r}## Loading Google fonts (https://fonts.google.com/)font_add_google("Gochi Hand", "gochi")font_add_google("Schoolbell", "bell")## Automatically use showtext to render textshowtext_auto()set.seed(123)df <-tibble(x =rnorm(1000))ggplot(df, mapping =aes(x = x)) +geom_histogram() +labs(title ="Histogram of Normal Random Numbers", y ="Freqency", x ="Using some different fonts") +theme_bw() +theme(plot.title =element_text(family ="gochi", size =rel(1.8)), axis.text =element_text(family ="bell", size =rel(2)), axis.title =element_text(family ="bell", size =rel(2)))```## Where are my local fonts?```{r}font_paths()```## Using local fonts```{r}font_add(family ="IBM Plex Mono", regular ="~/Library/Fonts/IBMPlexMono-Light.otf", bold ="~/Library/Fonts/IBMPlexMono-Medium.otf",italic ="~/Library/Fonts/IBMPlexMono-LightItalic.otf",bolditalic ="~/Library/Fonts/IBMPlexMono-MediumItalic.otf")ggplot(df, mapping =aes(x = x)) +geom_histogram() +labs(title ="Histogram of Normal Random Numbers", subtitle ="We can control the font face too",y ="Freqency", x ="Using some different fonts") +theme_bw() +theme(plot.title =element_text(family ="IBM Plex Mono", face ="bold", size =rel(1.8)), plot.subtitle =element_text(family ="IBM Plex Mono", face ="italic", size =rel(2)),# ggplot calls 'regular' 'plain'axis.text =element_text(family ="IBM Plex Mono", face ="plain", size =rel(2)), # Watch out for annoying but required period in bold.italicaxis.title =element_text(family ="IBM Plex Mono", face ="bold.italic", size =rel(2)))```